


01Your day
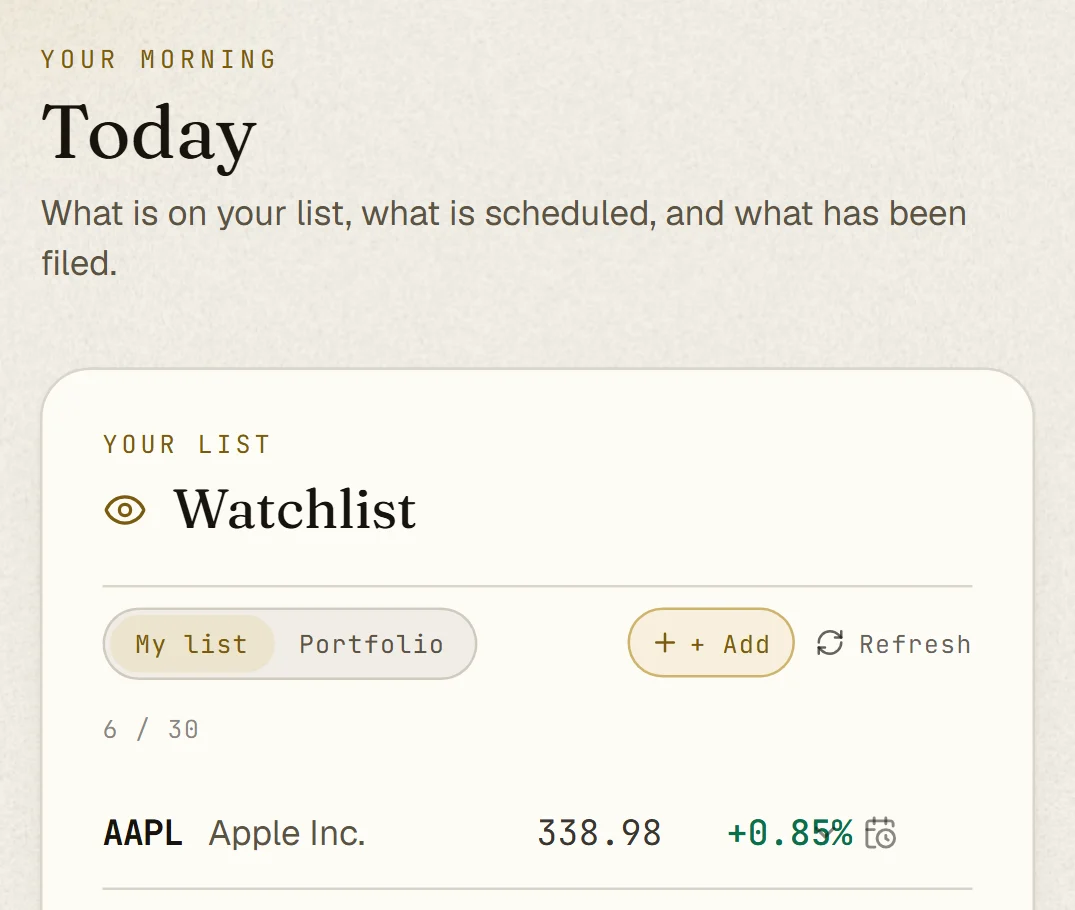
Today
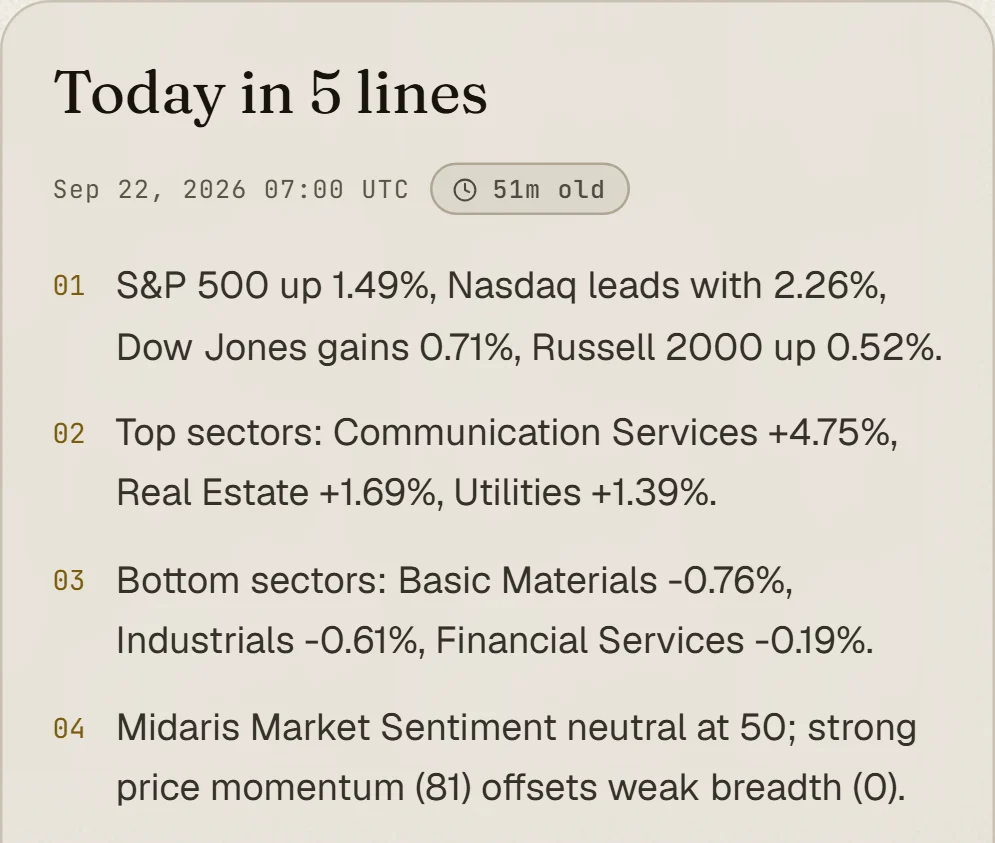
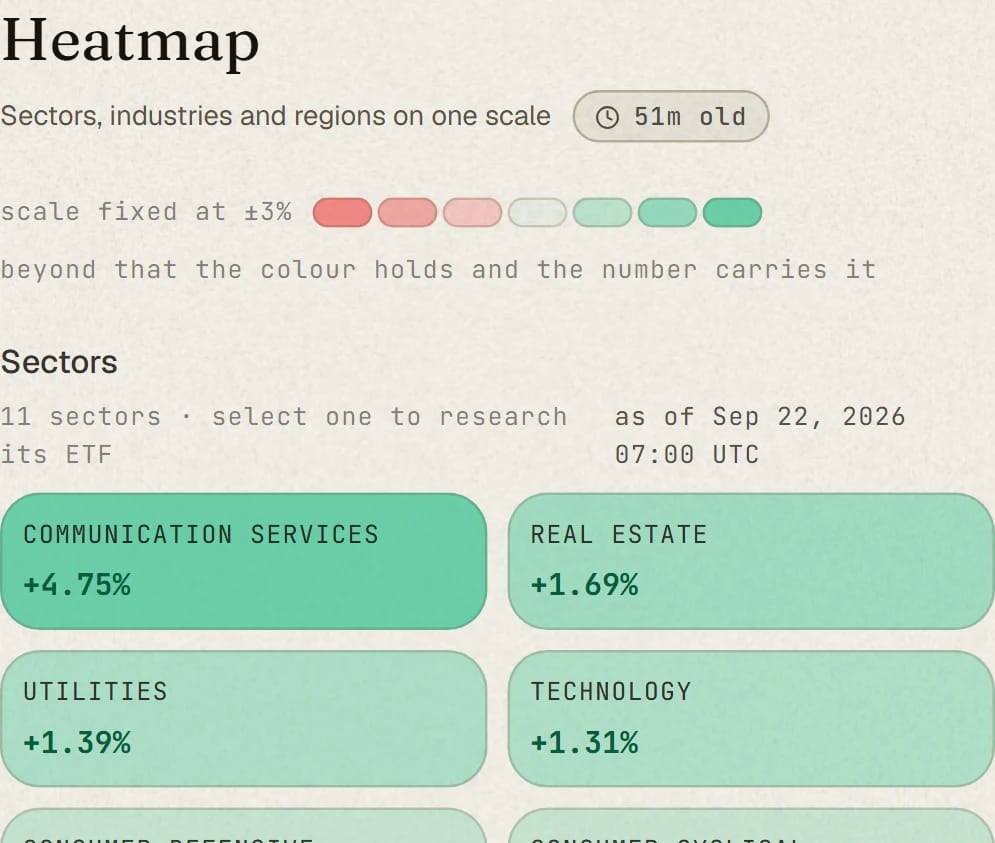
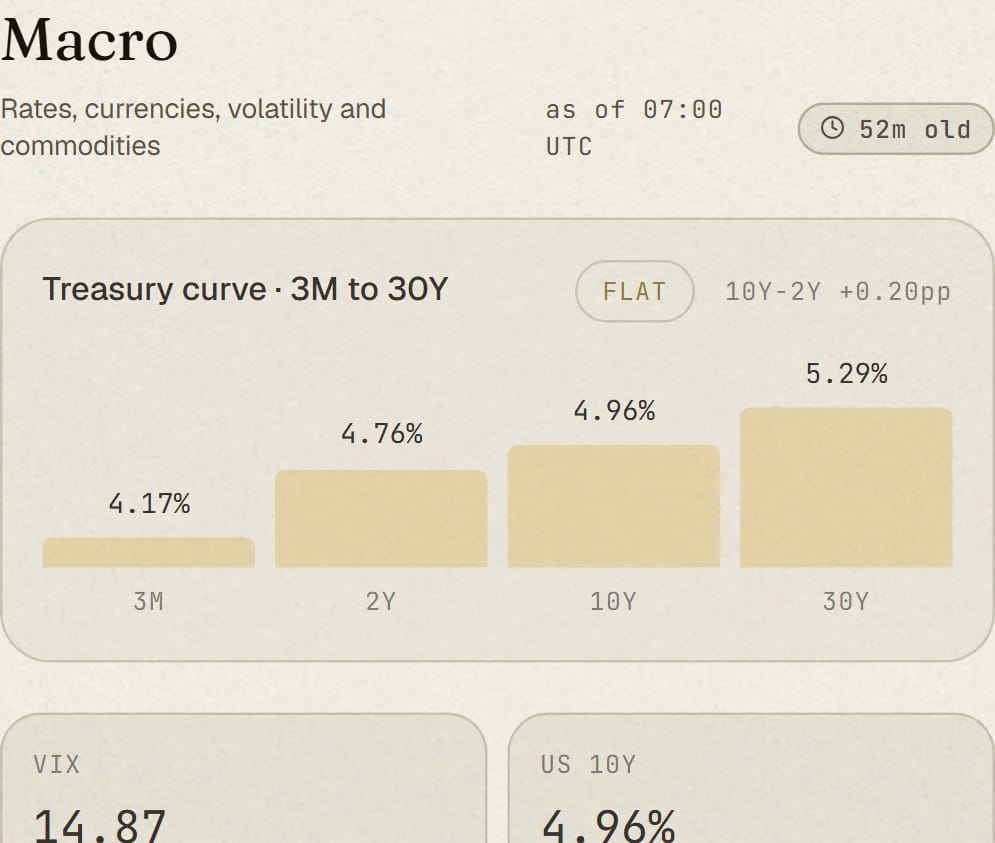
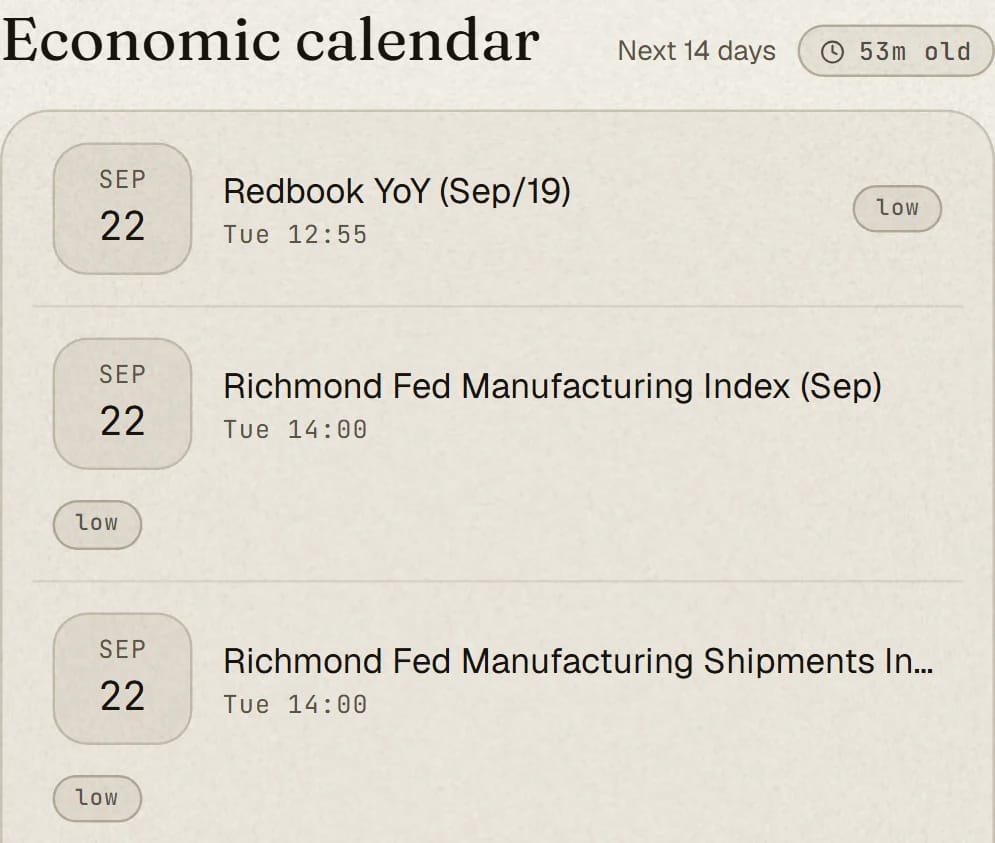
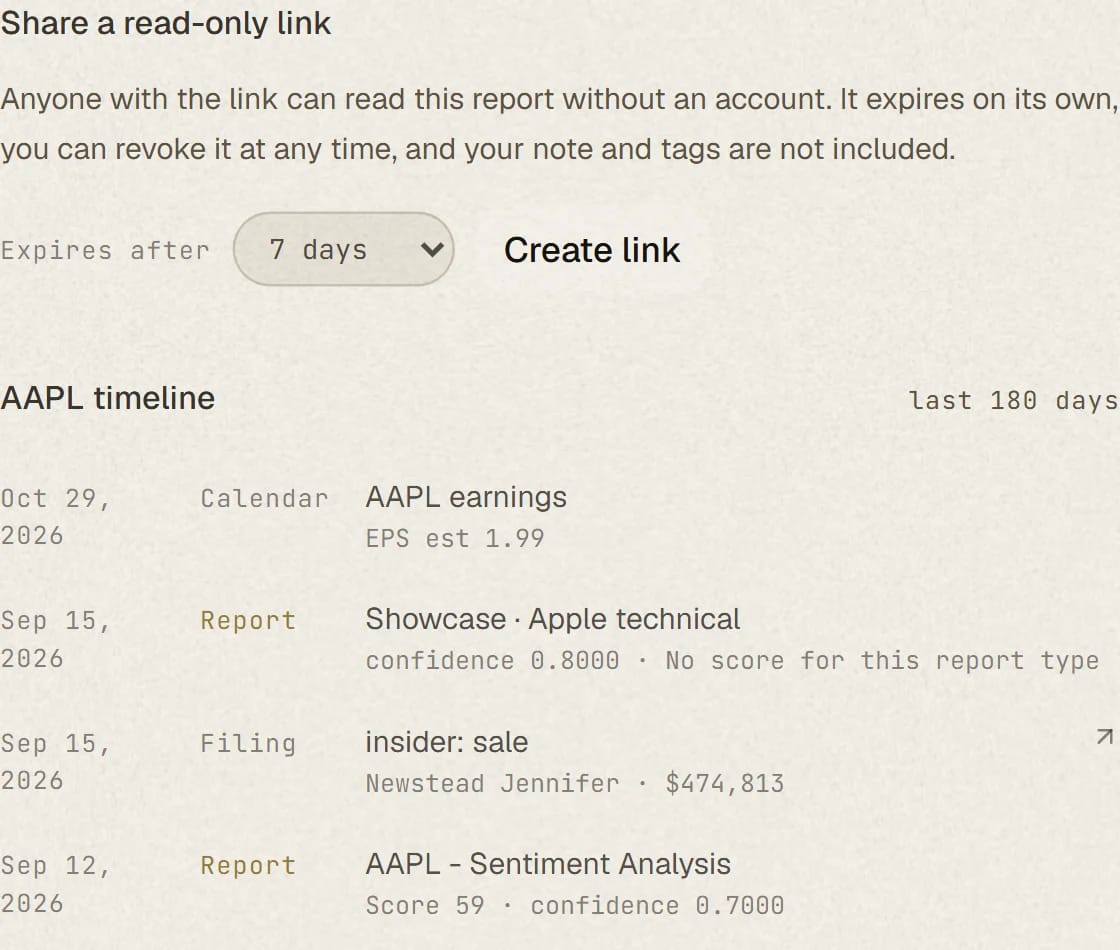
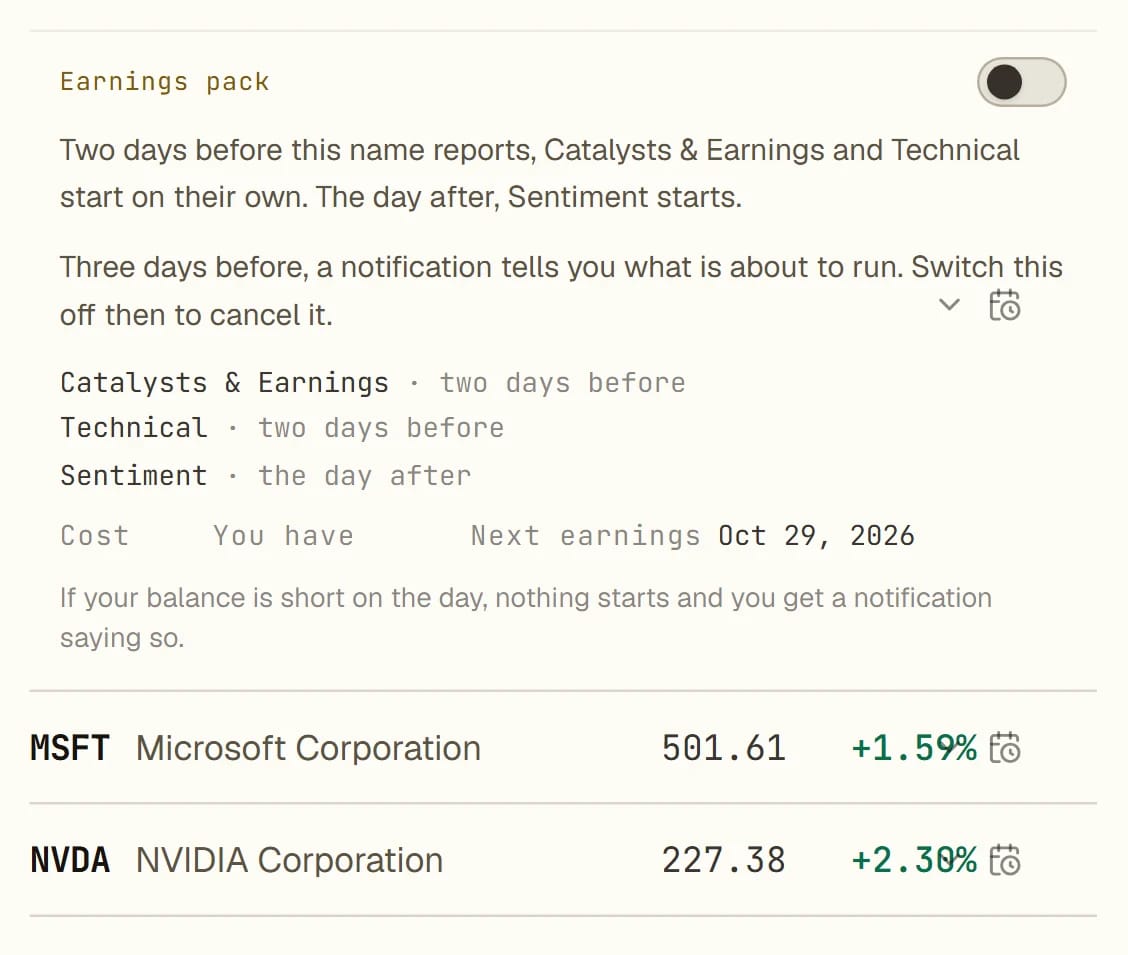
The page you open before the market does: your watchlist at the top, and under it the calendar, in your own timezone.
AI financial research & education
Hours of research, compiled in minutes.
Multi-timeframe technical structure with upside, base and downside scenarios. Fundamentals, sentiment, ETFs, commodities, macro and whole portfolios. Structured, sourced — every figure traceable.
Join the launch list — 30% off your first 3 months.
Reports, summaries and chat answers are generated by AI from public and licensed market data; they may contain errors and are research and education, not investment advice.
Inside Midaris
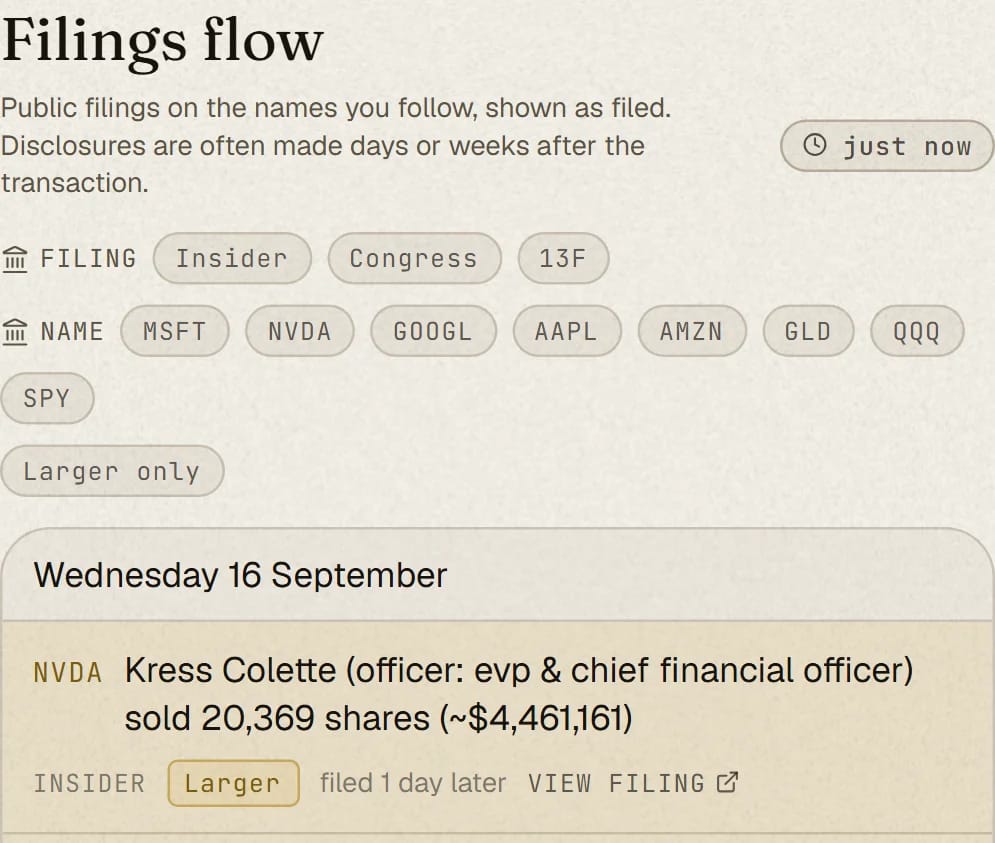
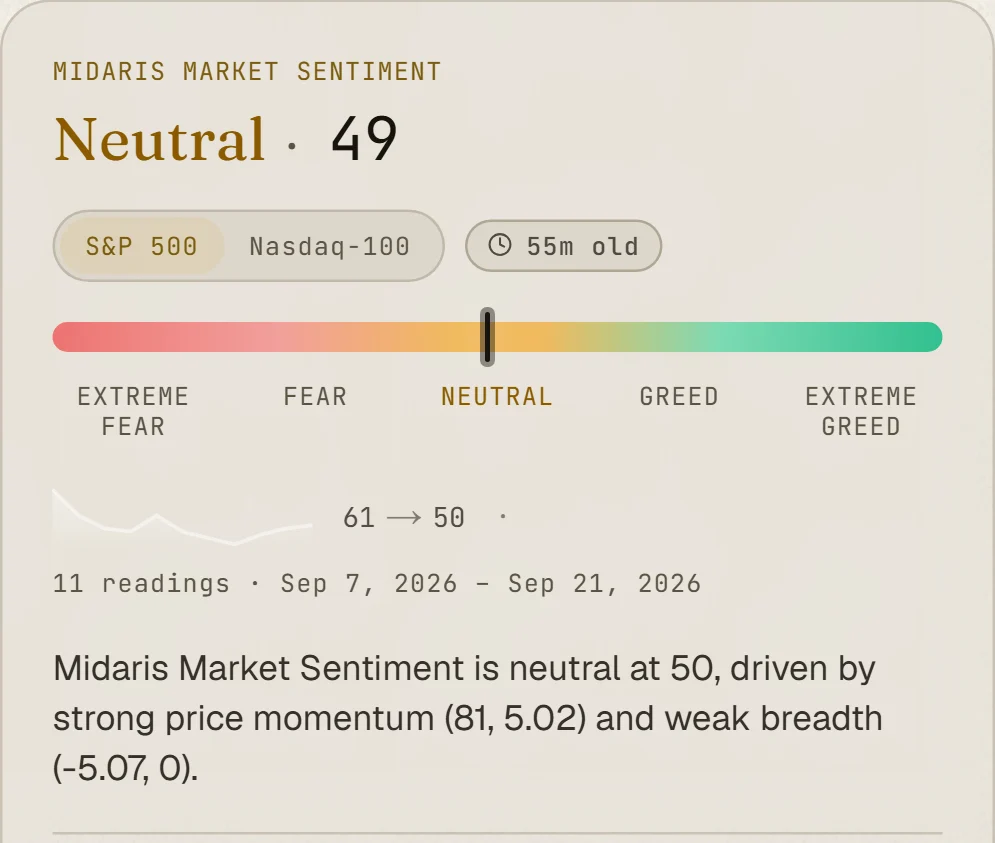
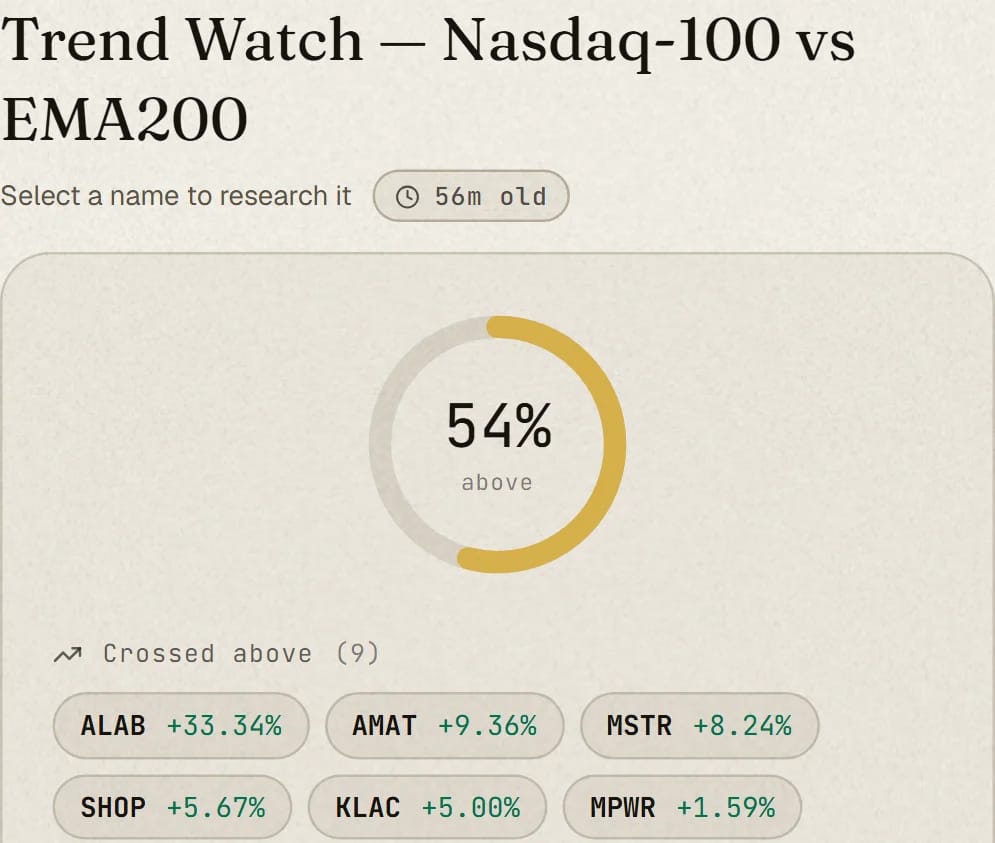
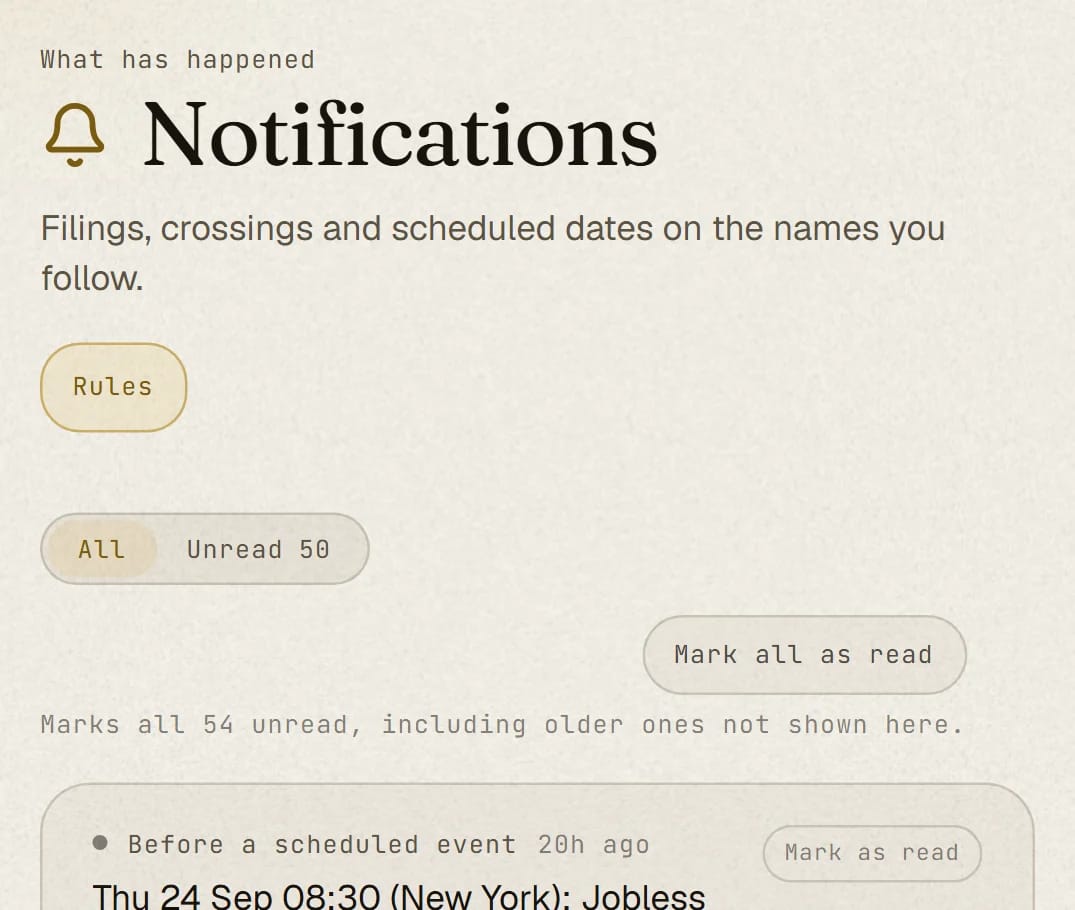
Every screen below is a real capture of the Midaris app. Nothing is staged.
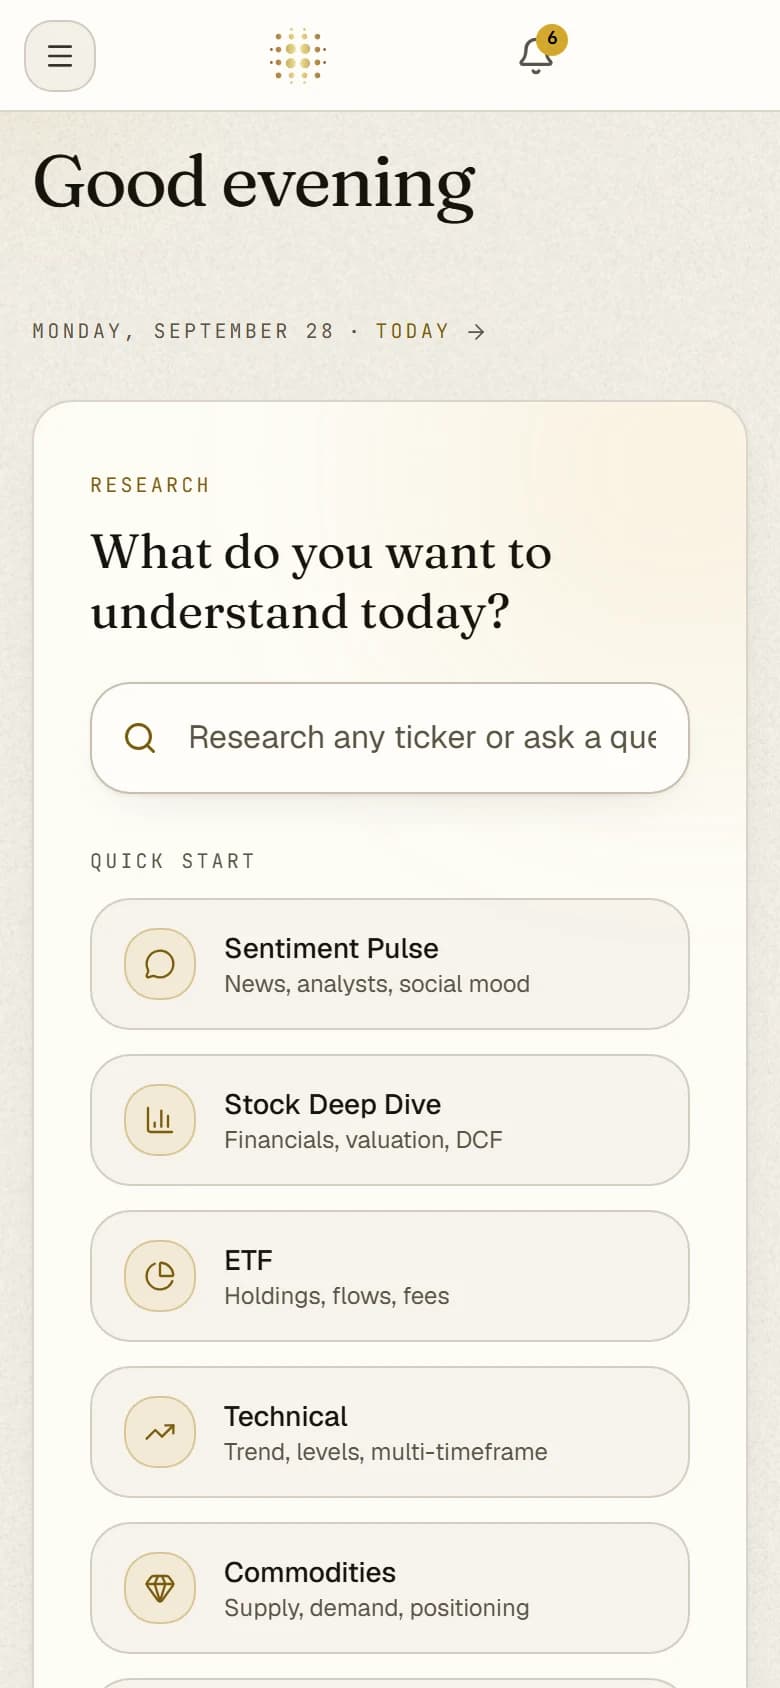
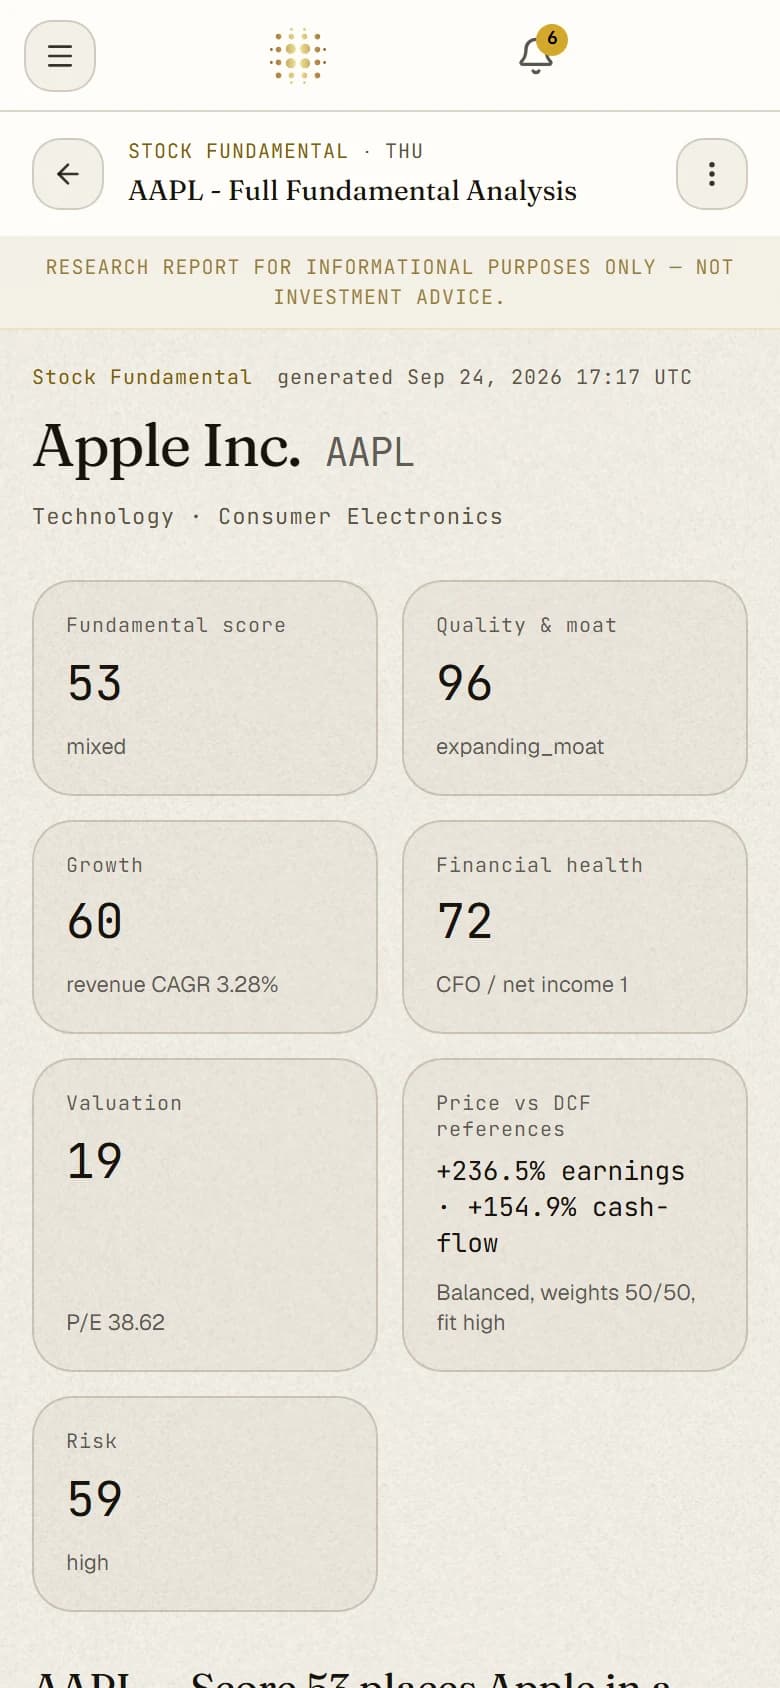
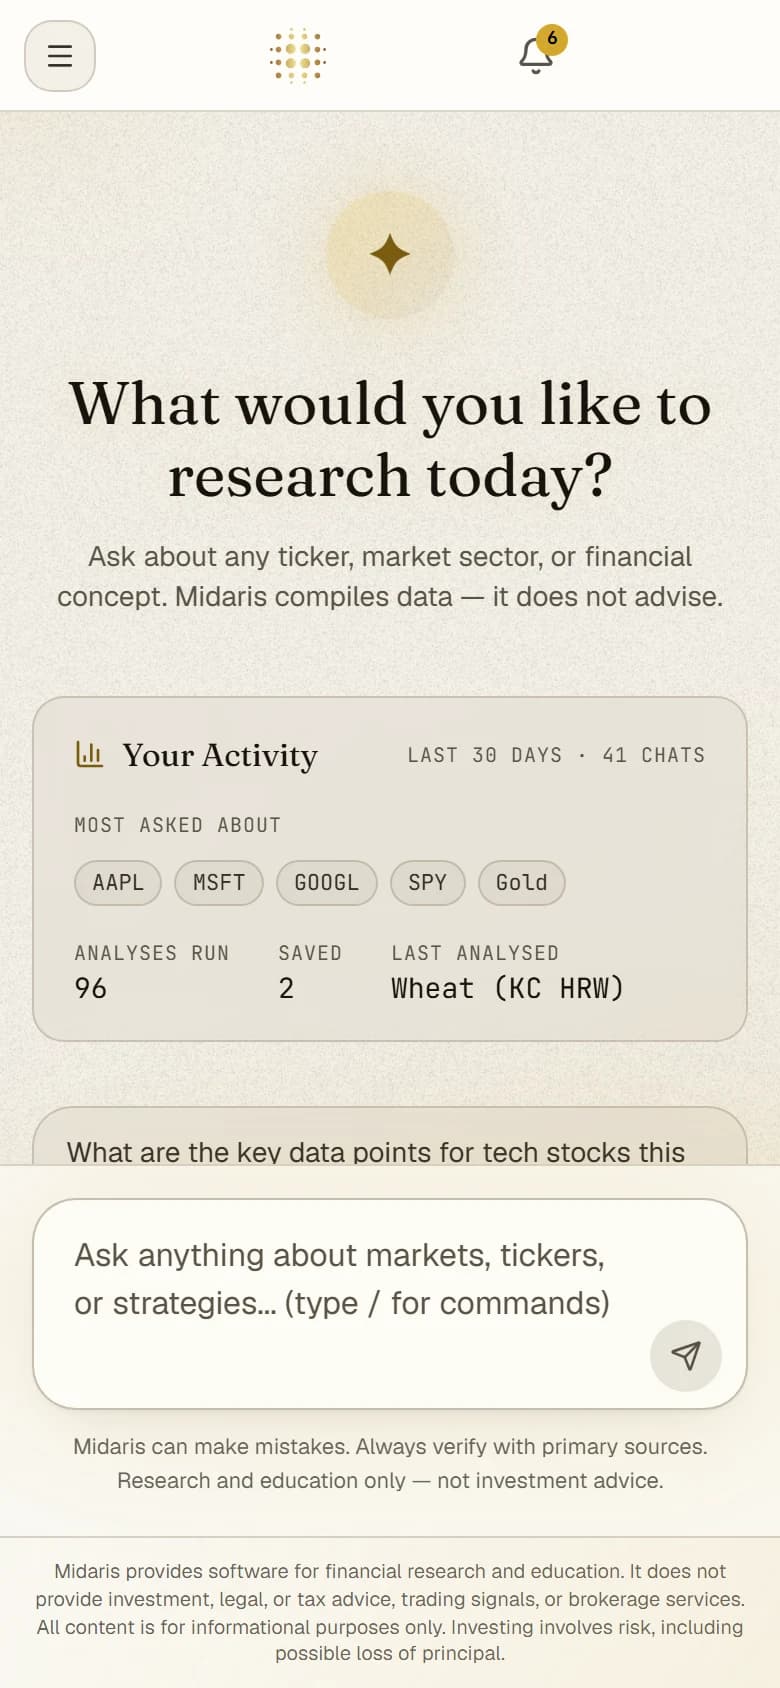
Research report for informational purposes only — not investment advice.
The name
Midas is the oldest story about value: a king who could turn anything to gold, and learned that gold without judgment is worth nothing. Polaris is the one star that does not move — for three thousand years, the fixed point navigators steered by.
Midaris joins the two. Gold, in our palette, stands for capital worth caring for; the star stands for the discipline of a fixed reference. Not a promise of gold — a way to read the data clearly.
What else is in there
The page you open before the market does: your watchlist at the top, and under it the calendar, in your own timezone.
Today
The page you open before the market does: your watchlist at the top, and under it the calendar, in your own timezone.
Reports, summaries and chat answers are generated by AI from public and licensed market data; they may contain errors and are research and education, not investment advice.
How it works
No prompts to engineer and no dashboards to configure. You name the subject; Midaris does the compiling and shows its sources.
Pick a research module and give it a ticker, a commodity, a macro question or a saved portfolio. Of the 10 report types, Starter runs 6; Professional and Advisor run all 10.
The module gathers public market data — fundamentals, prices, news, analyst actions, positioning, macro series — and organises it into scored sections, with its sources and data gaps named.
A structured report lands in your library. Read it on screen, export it as a branded, paginated PDF, or take it into research chat and keep asking questions of the same data.
What it produces
Every screenshot below is a completed Midaris report. Each type has a fixed structure, so two reports on two tickers can be read side by side — and every one of them has a full sample you can read.
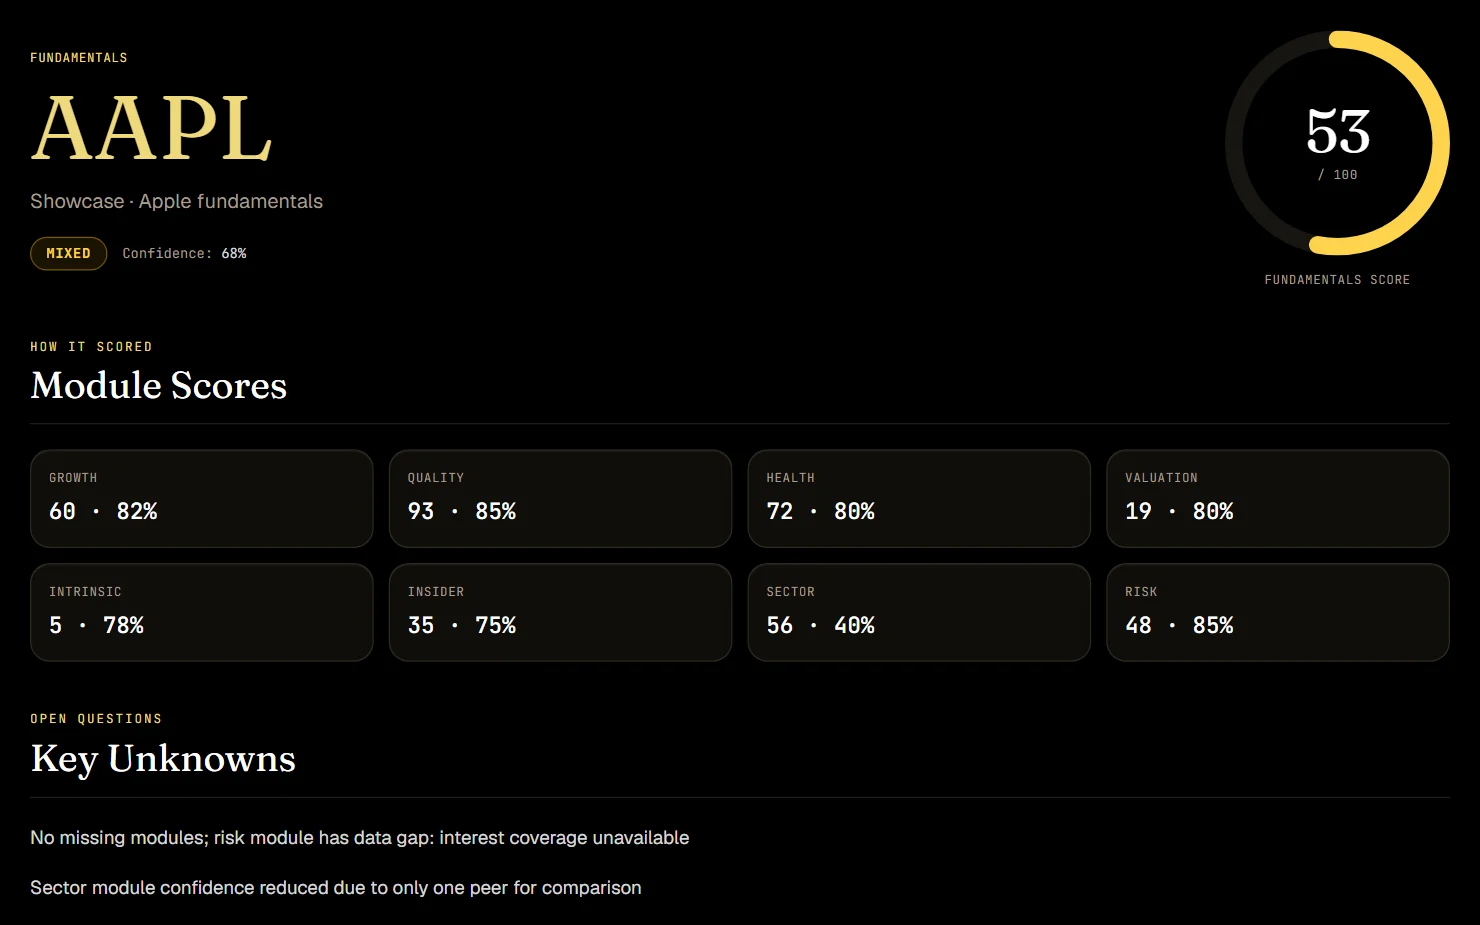
Eight scored modules — growth, quality and moat, financial health, valuation, intrinsic value, insider activity, sector context, risk — collapsed into one 0–100 score, then opened back up: drivers, risks, open questions, evidence. The whole balance sheet, argued.
See the full sample report How to read a Fundamentals reportResearch report for informational purposes only — not investment advice.
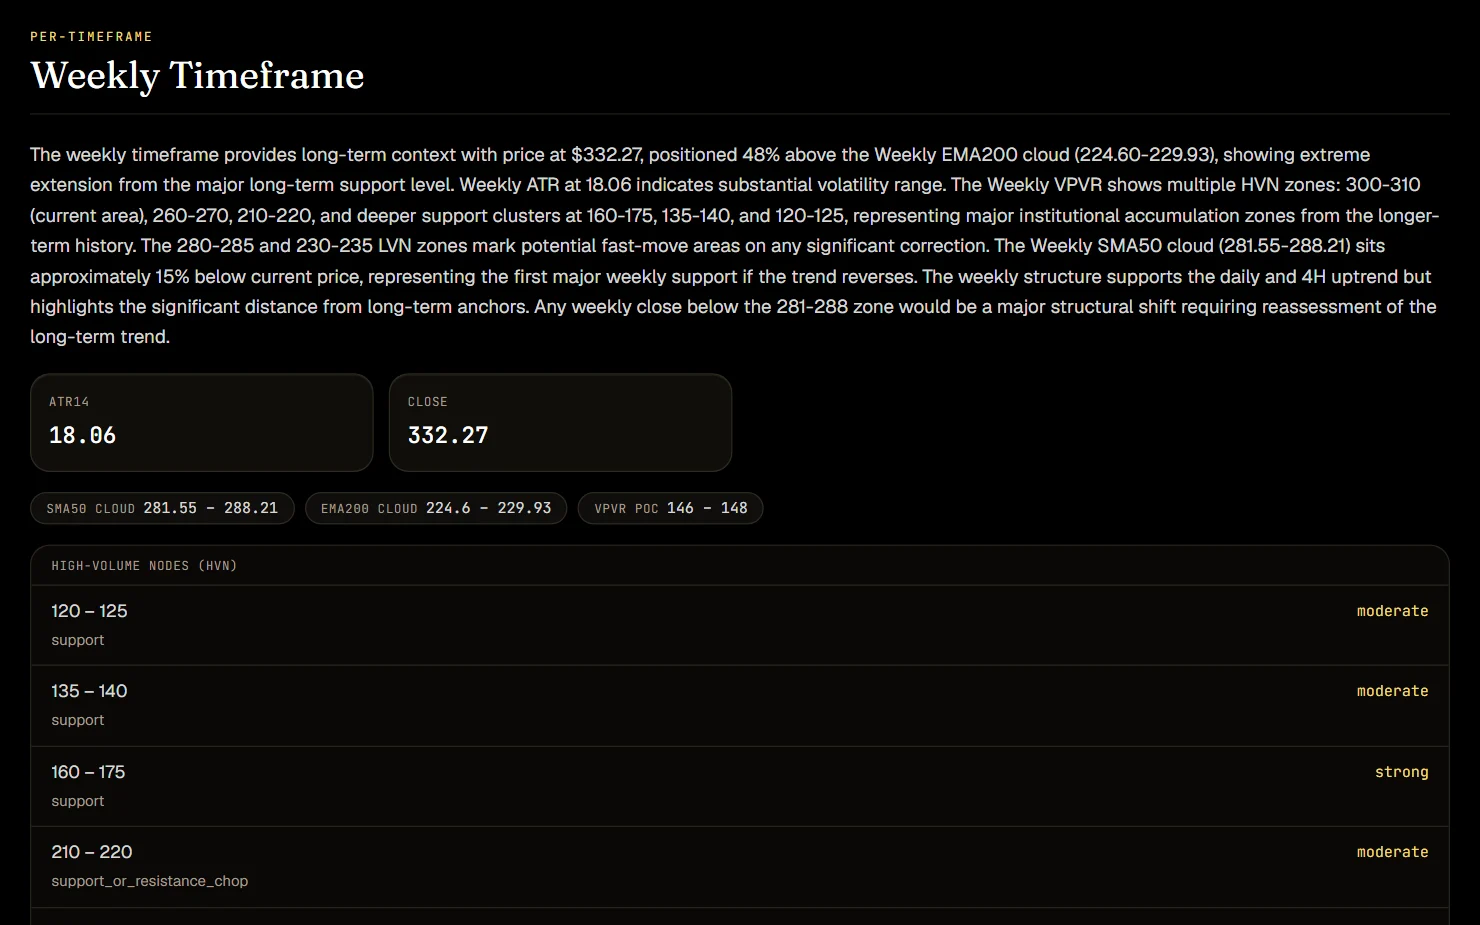
Three timeframes — 4-hour, daily, weekly — read as one structure: moving-average clouds, volume profile, key levels, momentum and volatility. Then three scenarios, upside, base and downside, each written out as reasons and red flags. For education; no score is assigned.
See the full sample report How to read a Technical reportResearch report for informational purposes only — not investment advice.
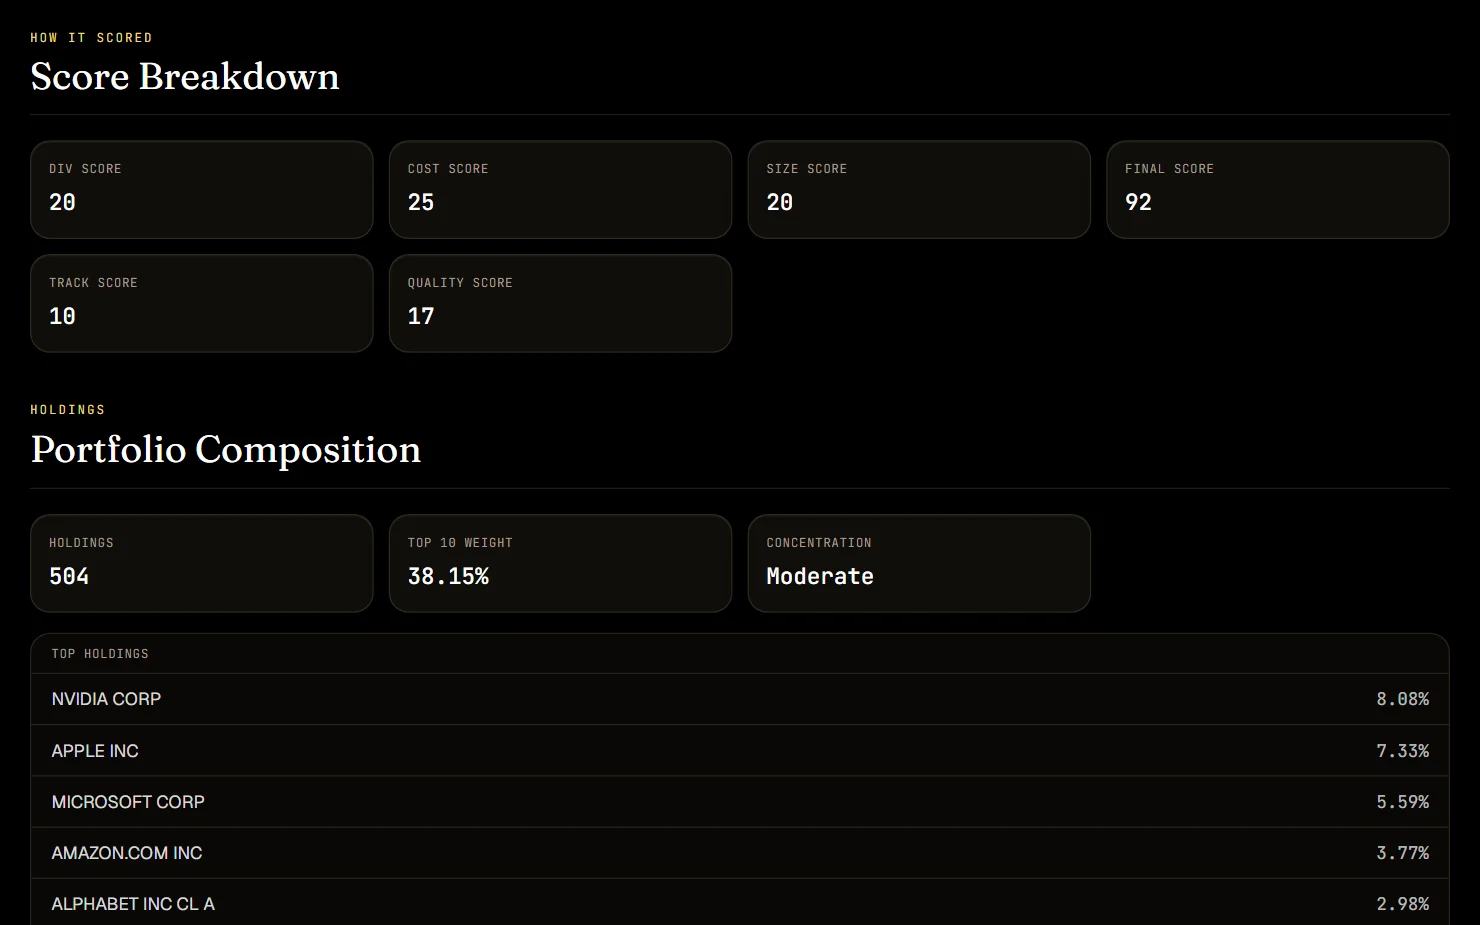
Cost, dividend, size, quality and track record, each scored; the fund’s profile, top holdings and concentration, sector and geographic exposure. Strengths and concerns, with sources — the fund read, not the fact sheet.
See the full sample report How to read an ETF reportResearch report for informational purposes only — not investment advice.
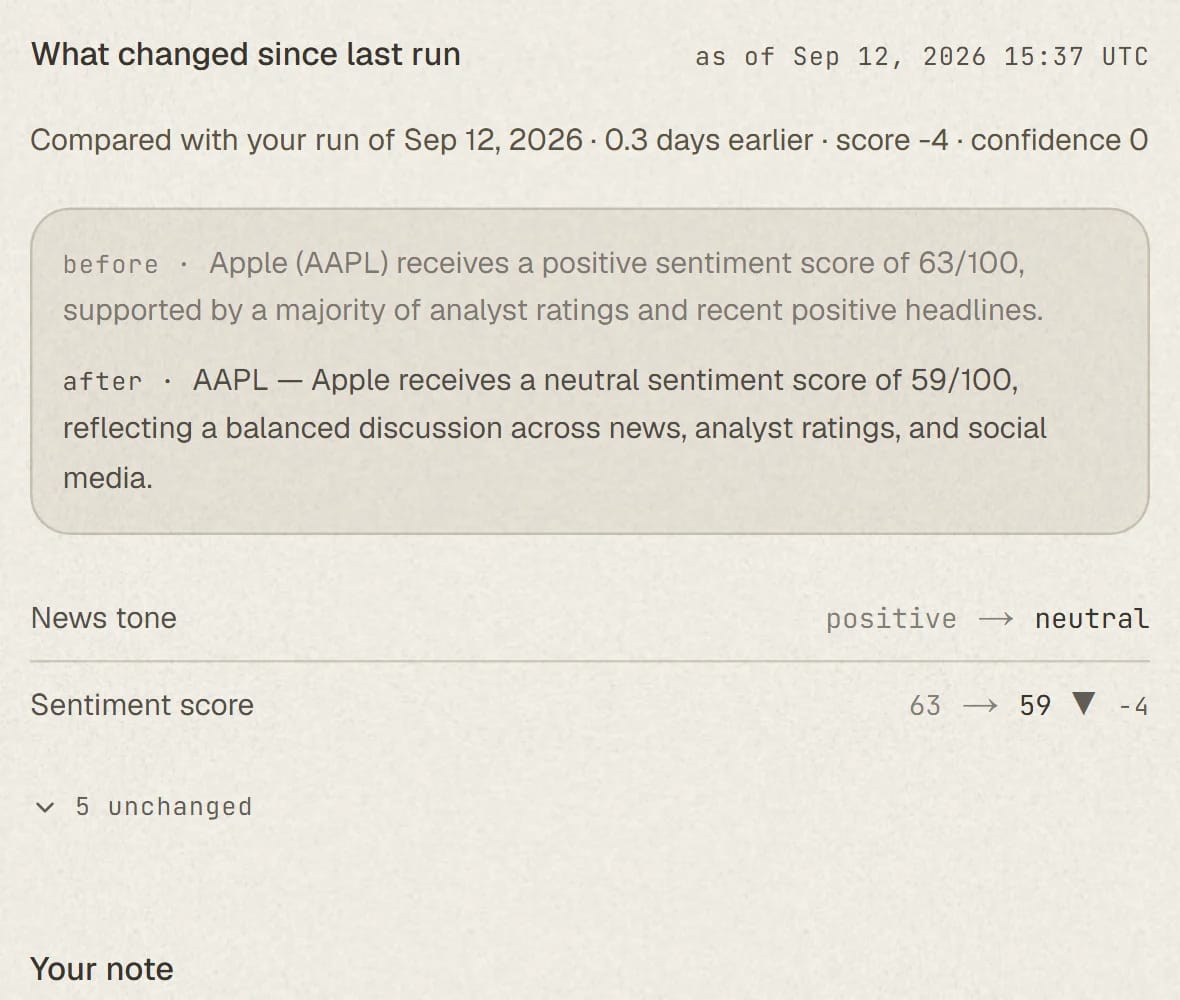
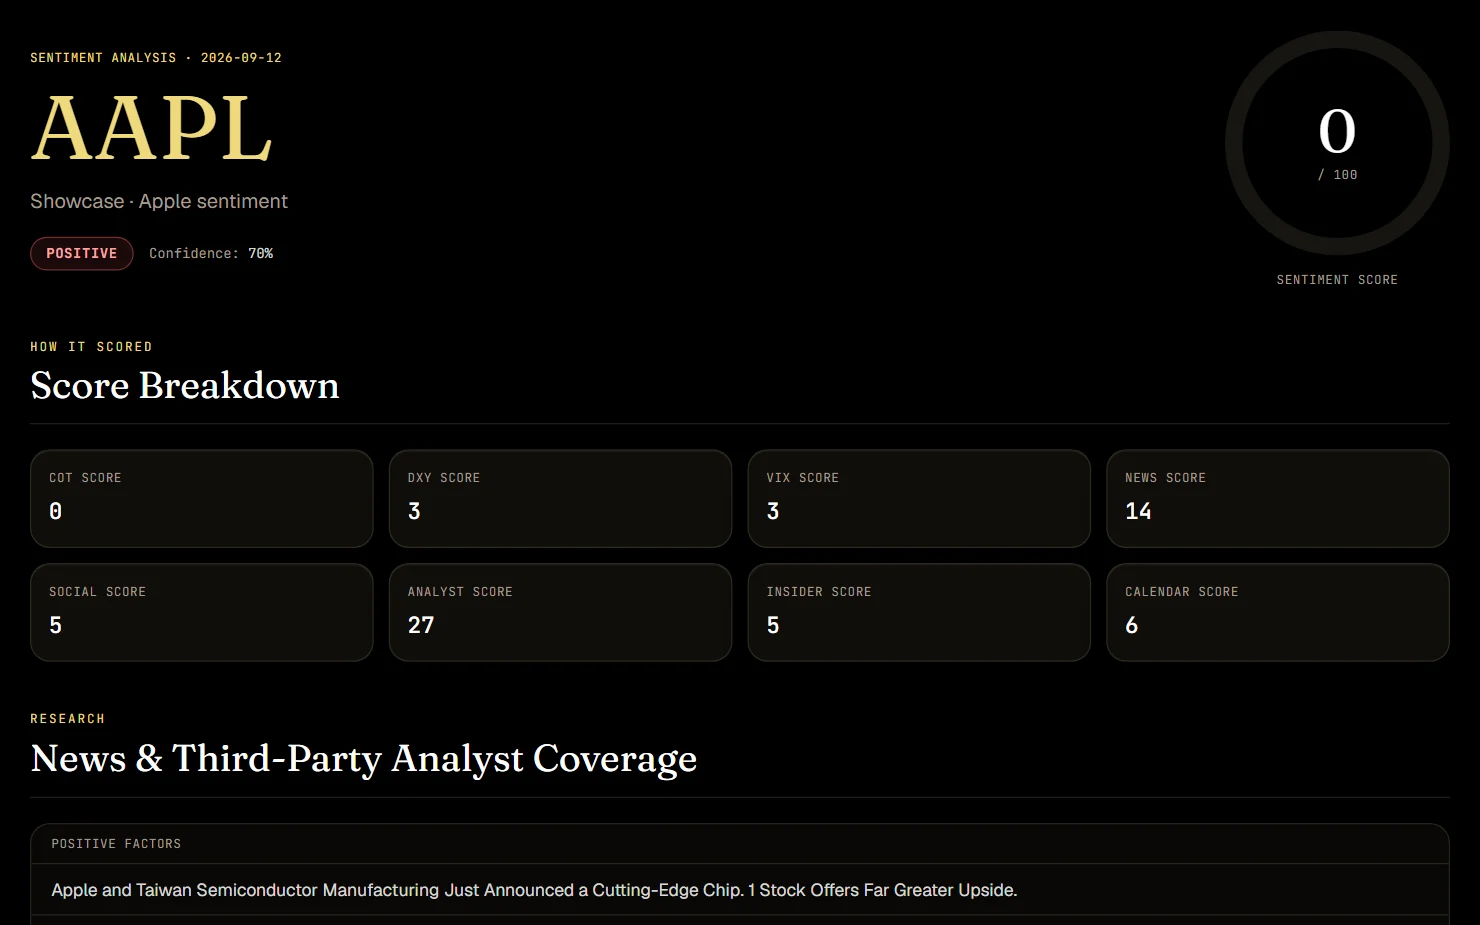
One 0–100 mood score built from eight parts — news, analyst actions, social (X, Reddit, StockTwits), VIX, DXY, insider activity, the calendar, COT positioning — every part shown, so you see what moved the number.
See the full sample report How to read a Sentiment reportResearch report for informational purposes only — not investment advice.
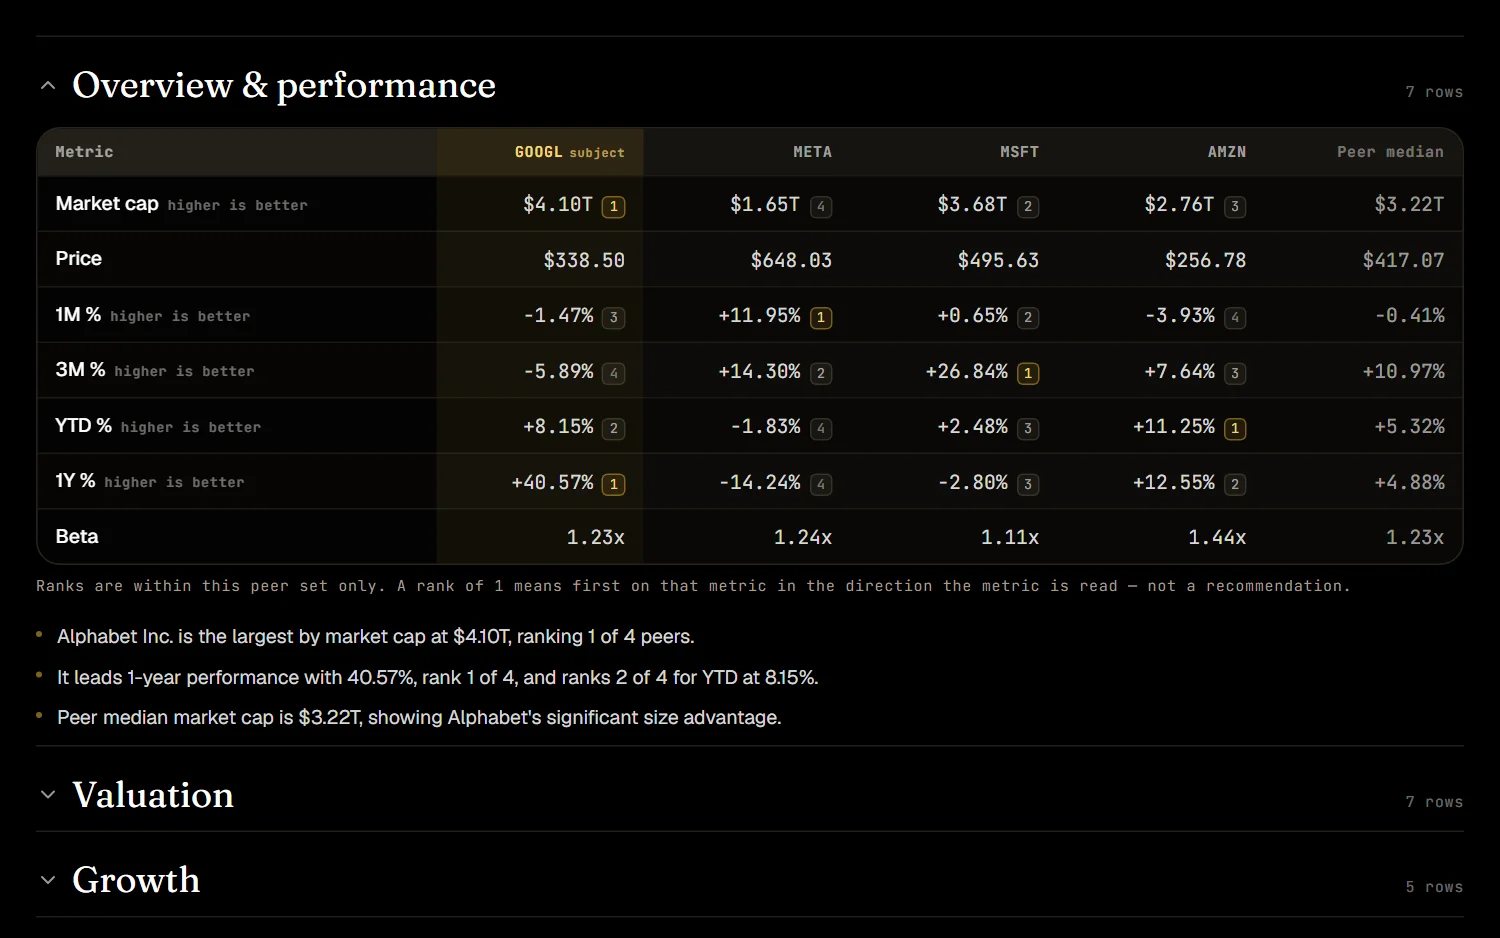
One ticker against the peers that actually compete with it — chosen deterministically by industry, then size — on valuation, growth, margins and quality, side by side, with every peer named and every number sourced.
Professional and AdvisorSee the full sample report How to read a Peer Comparison reportResearch report for informational purposes only — not investment advice.
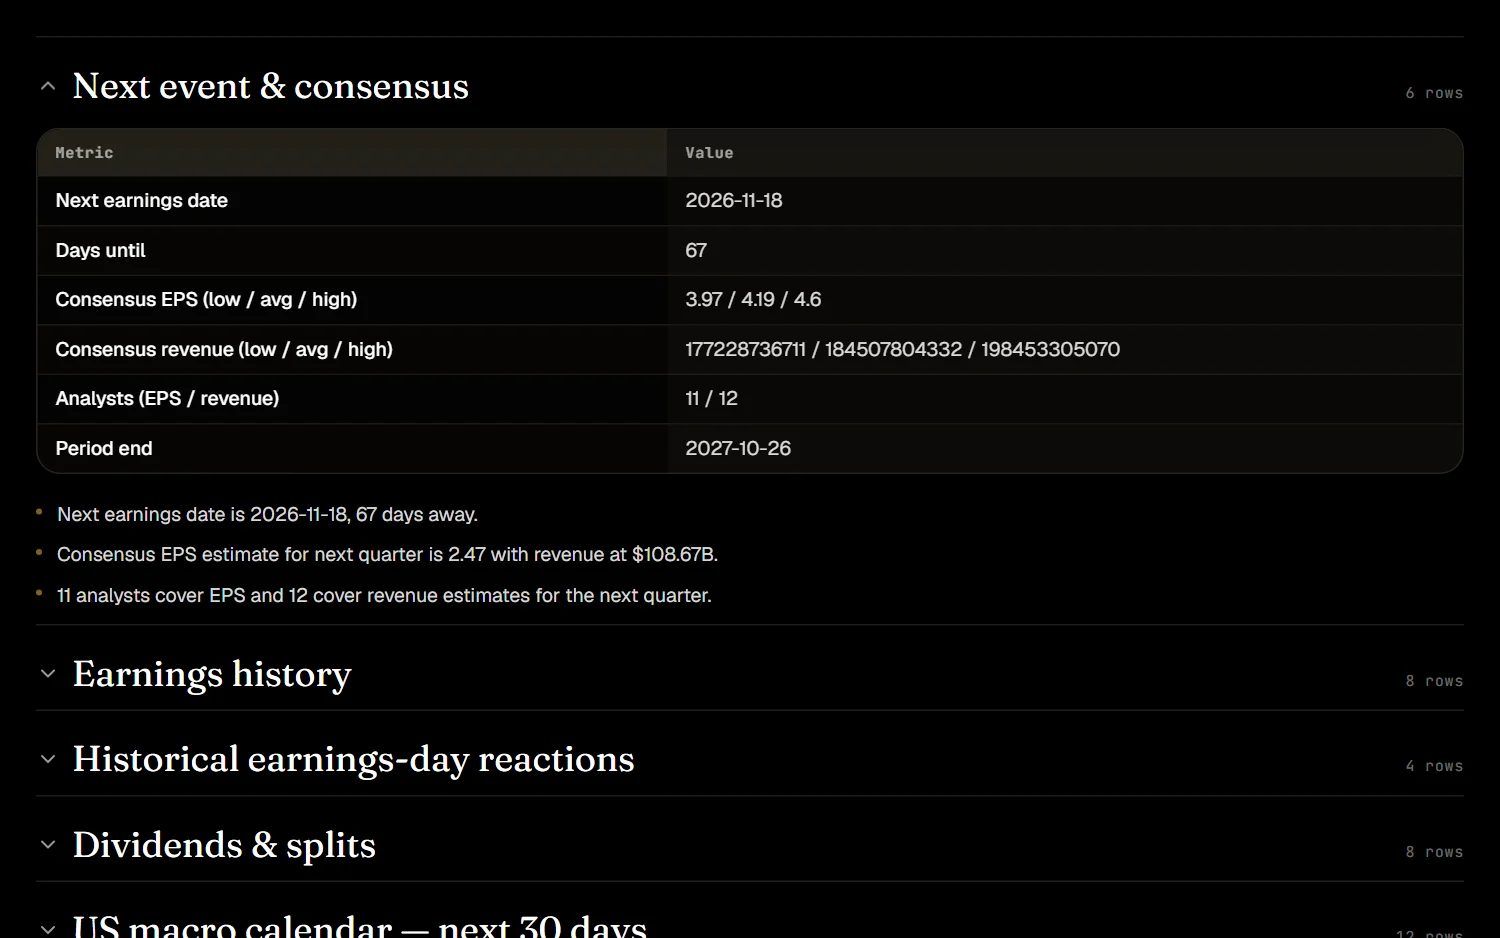
The dated events that can move a name: earnings history and the next report, guidance, product and regulatory dates, dividends and buybacks — laid out as a timeline with what each one has meant before.
Professional and AdvisorSee the full sample report How to read a Catalysts & Earnings reportResearch report for informational purposes only — not investment advice.
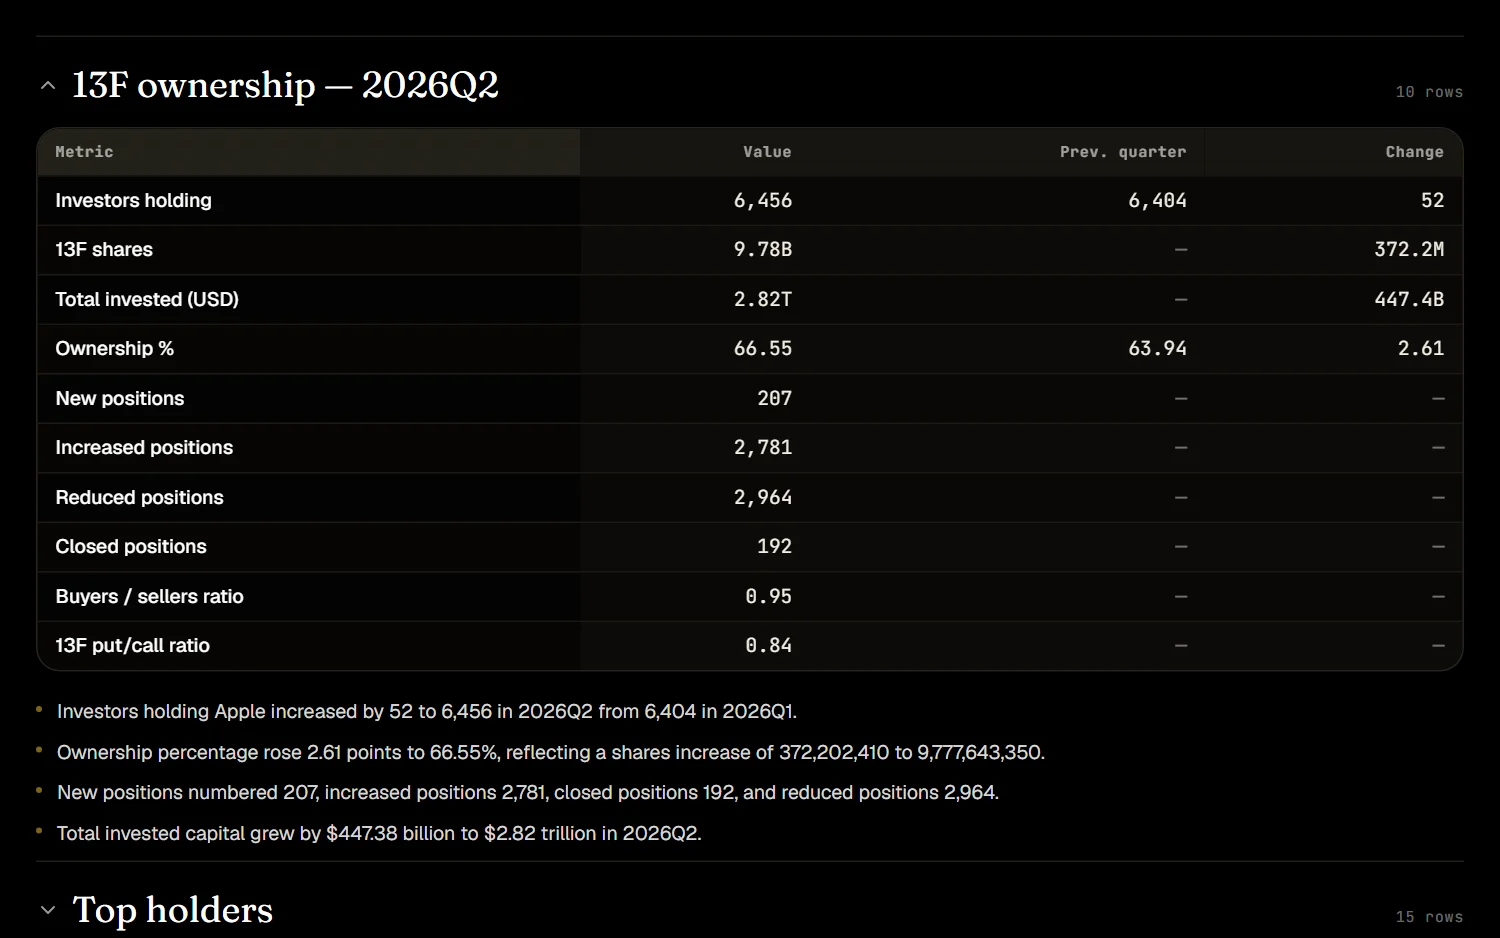
Who holds it and how that changed: 13F institutional holders and their quarter-on-quarter moves, insider Form 4 transactions, ownership concentration — as filed, organised, sourced.
Professional and AdvisorSee the full sample report How to read an Institutional Positioning reportResearch report for informational purposes only — not investment advice.
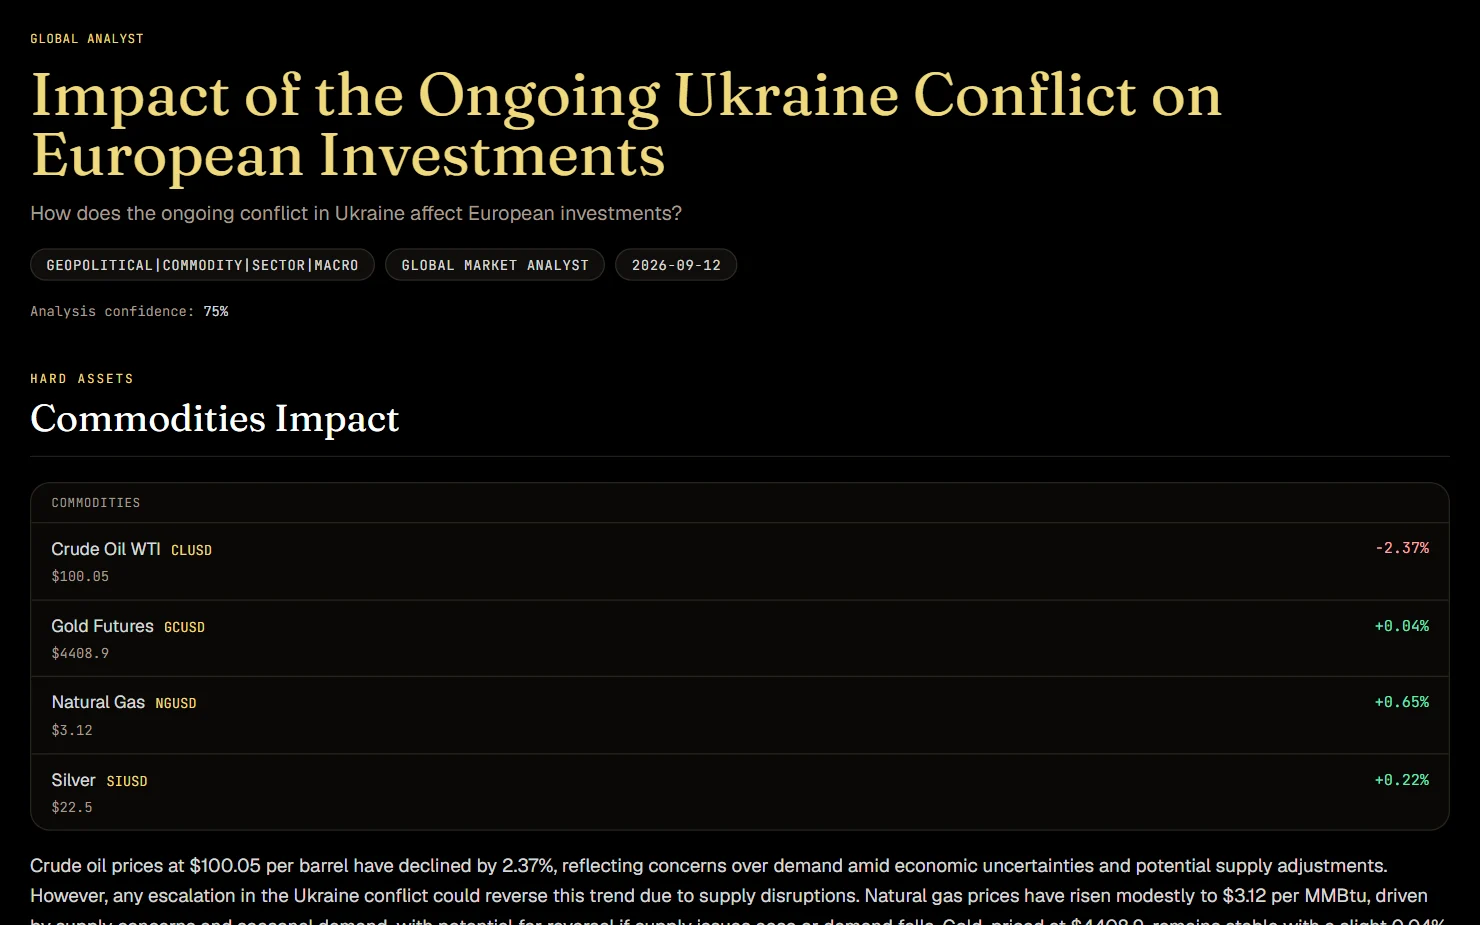
A macro question, answered as a briefing: market regime, sector moves, commodity and equity read-through, scenario analysis, a timeline of what to watch, the risks to monitor.
See the full sample report How to read a Global Market reportResearch report for informational purposes only — not investment advice.
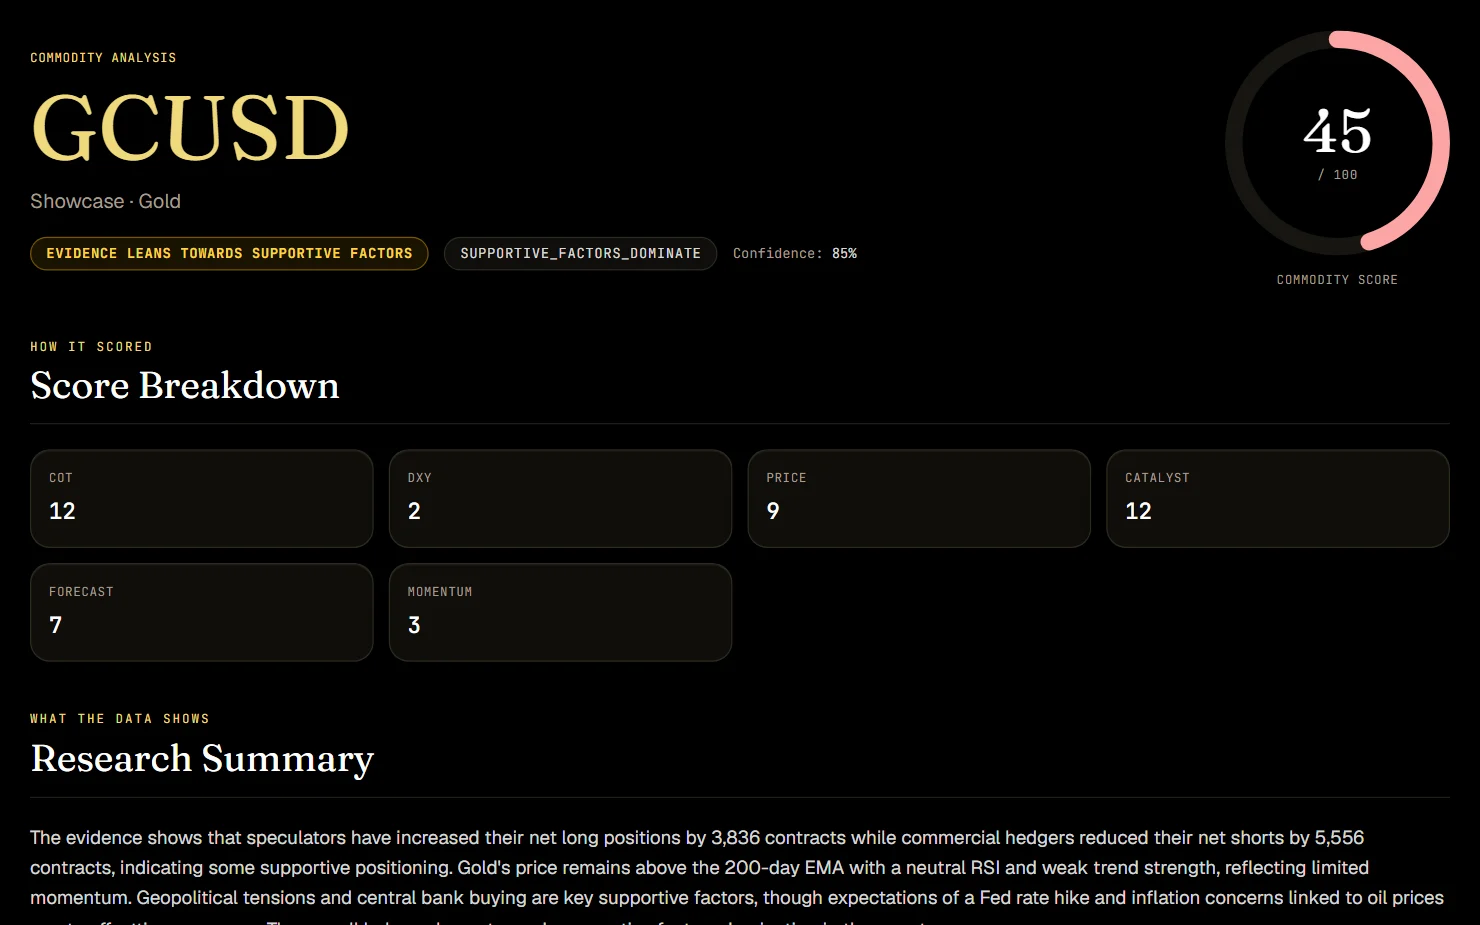
One commodity, end to end: market status, technical readings, COT positioning, dollar context, and the catalysts across supply and demand, news and geopolitics — scored, with evidence, reasons and red flags.
See the full sample report How to read a Commodity reportResearch report for informational purposes only — not investment advice.
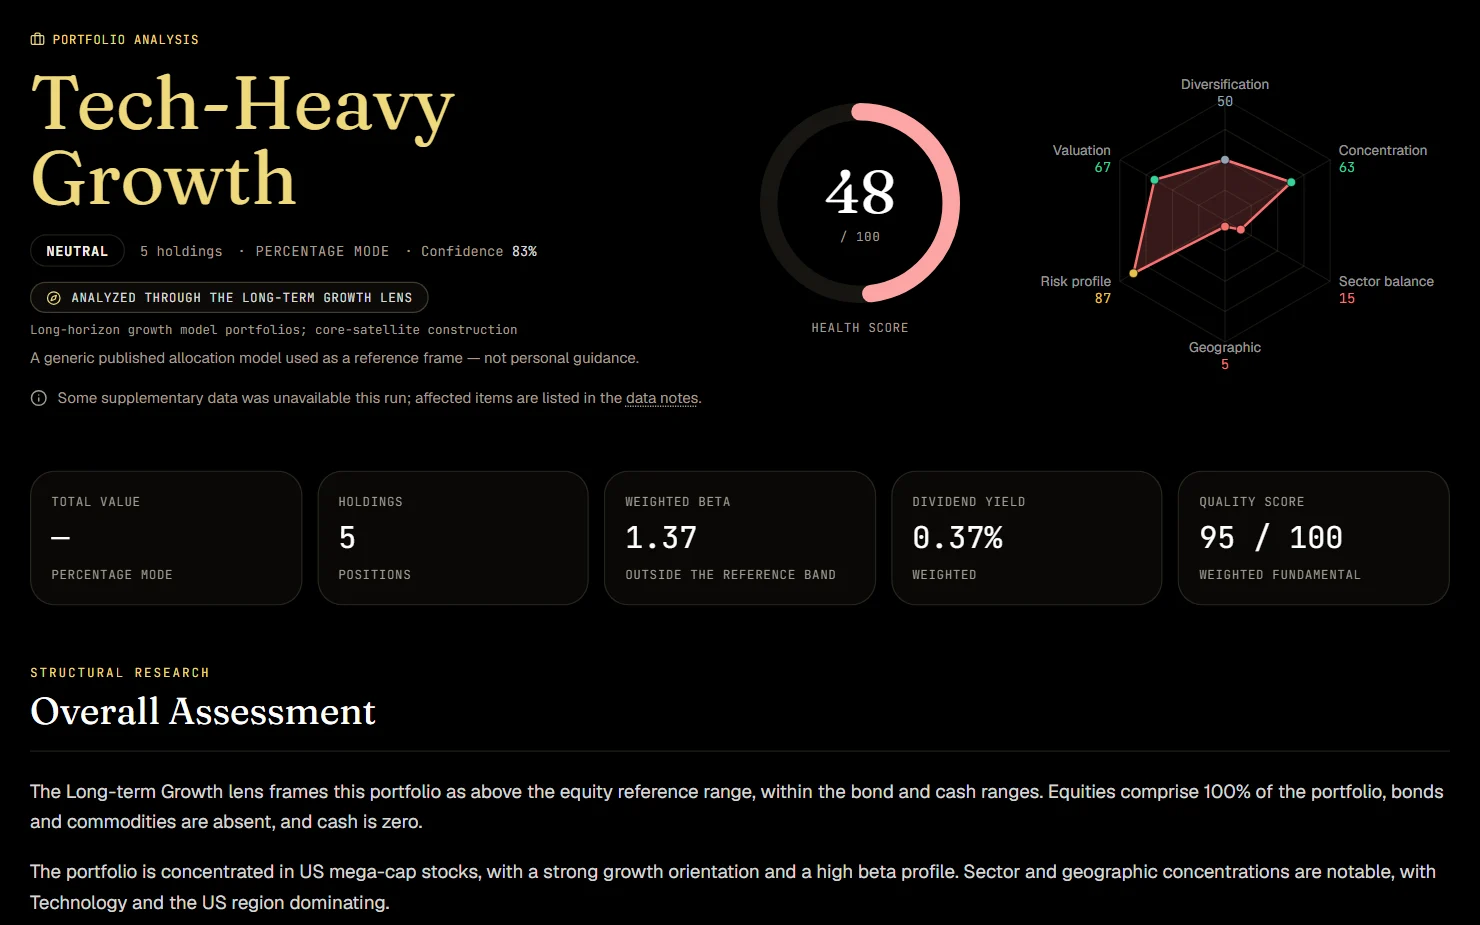
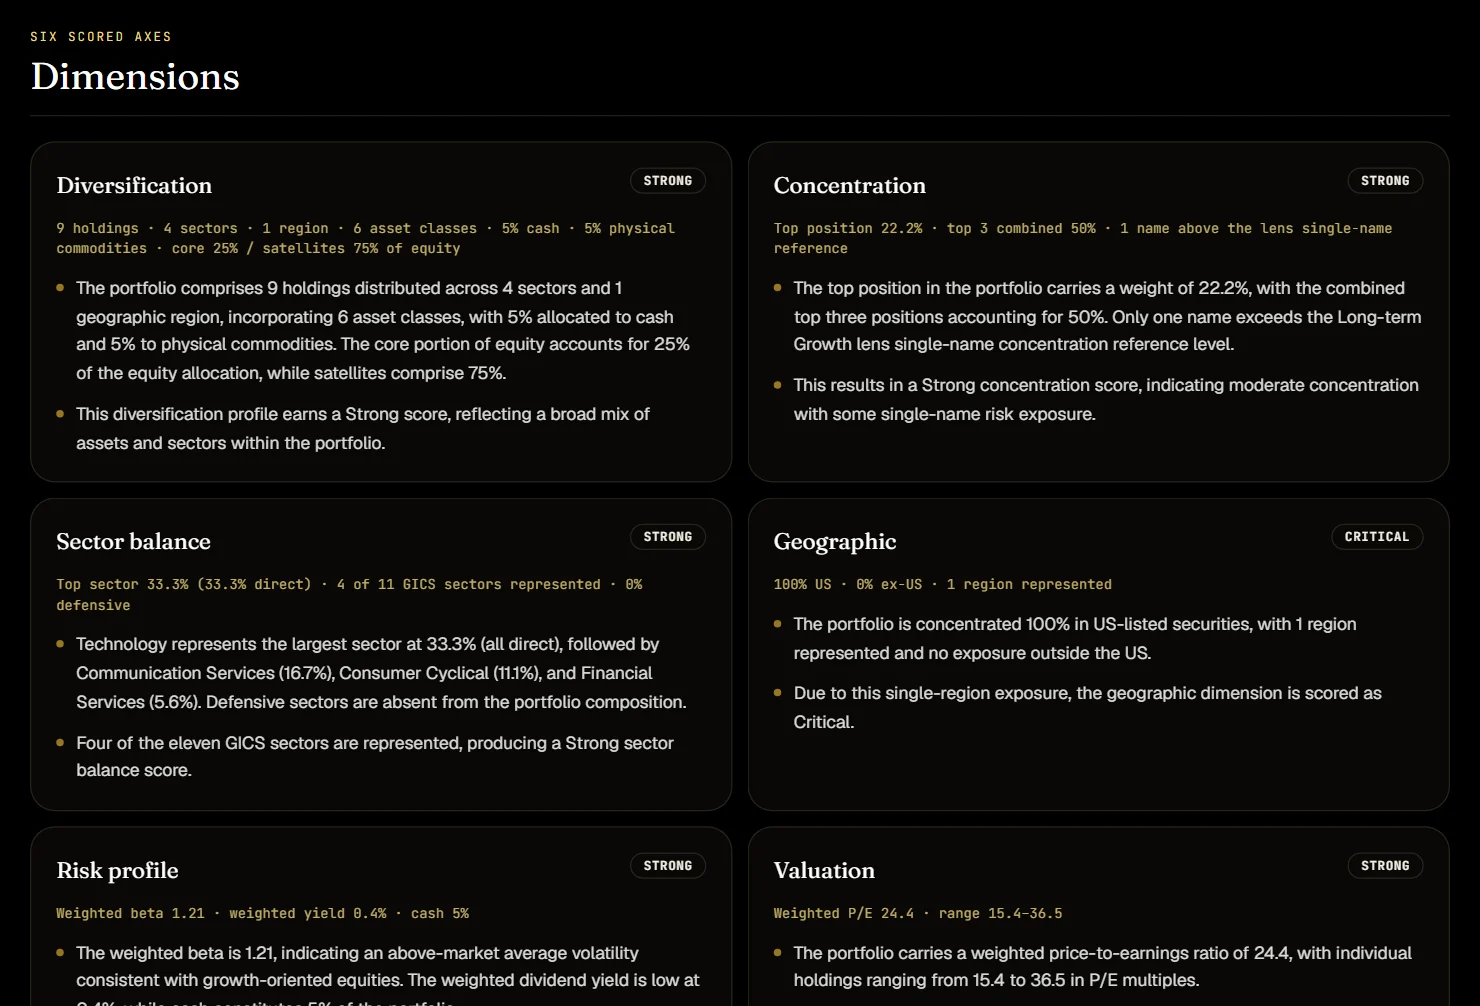
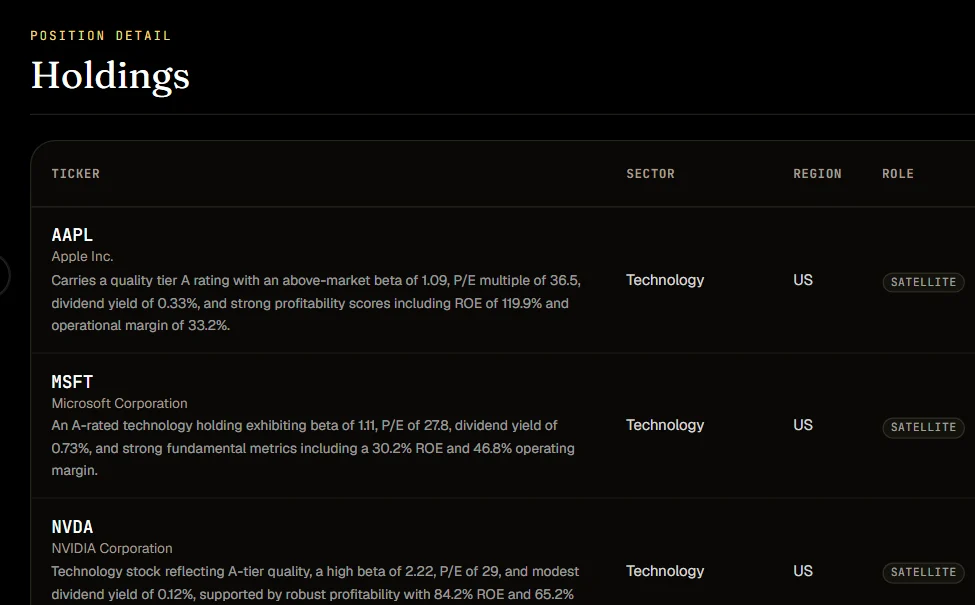
A health score and a six-dimension radar — diversification, concentration, sector balance, geography, risk profile, valuation — then composition, weights, factor tilts and every holding, all read through one of four published reference models.
Professional and AdvisorSee the full sample report How to read a Portfolio Analysis reportResearch report for informational purposes only — not investment advice.
Reports, summaries and chat answers are generated by AI from public and licensed market data; they may contain errors and are research and education, not investment advice.
Portfolios & lenses
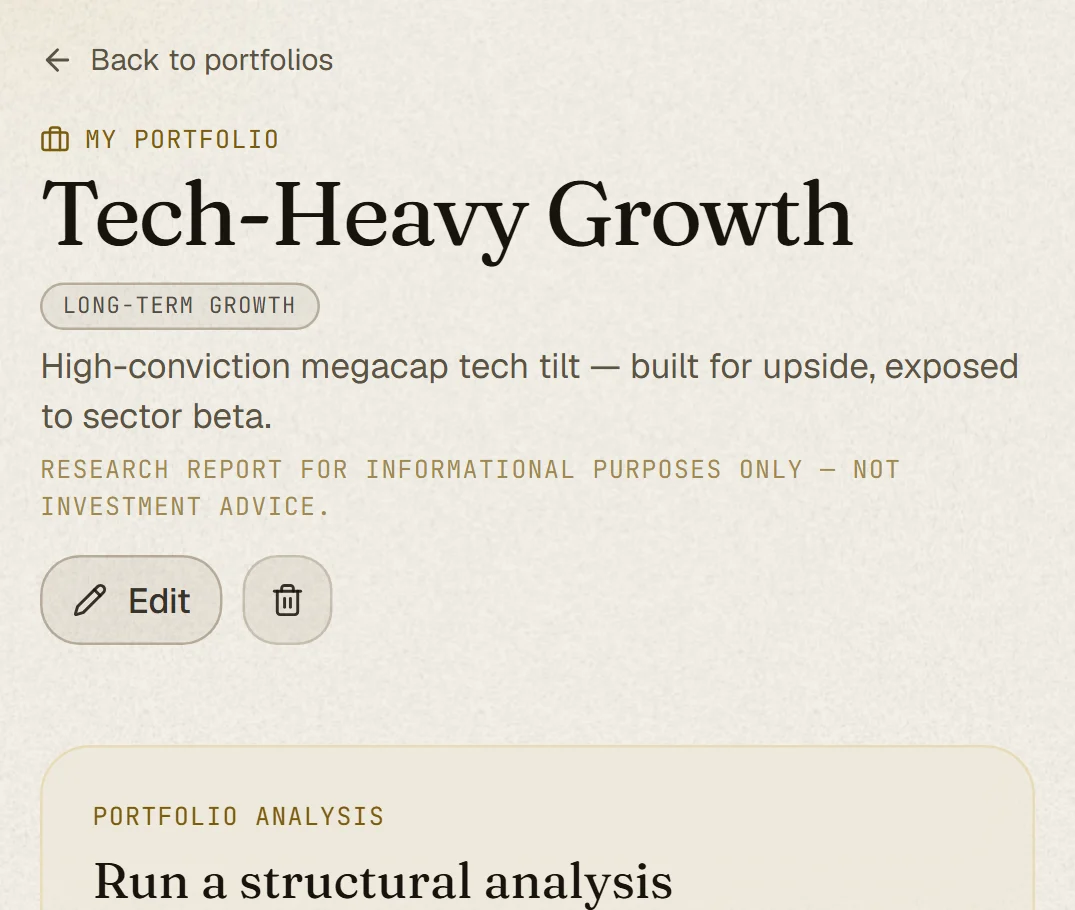
Save holdings by percentage or dollars. Portfolio Analysis scores the structure on six dimensions and reads it through one of four published reference frames — a lens — used only as a benchmark, never as guidance. Available on Professional and Advisor.
Lenses are generic published allocation models. Choosing one compares your portfolio to that model; it is not personal guidance.
Research report for informational purposes only — not investment advice.
Research chat
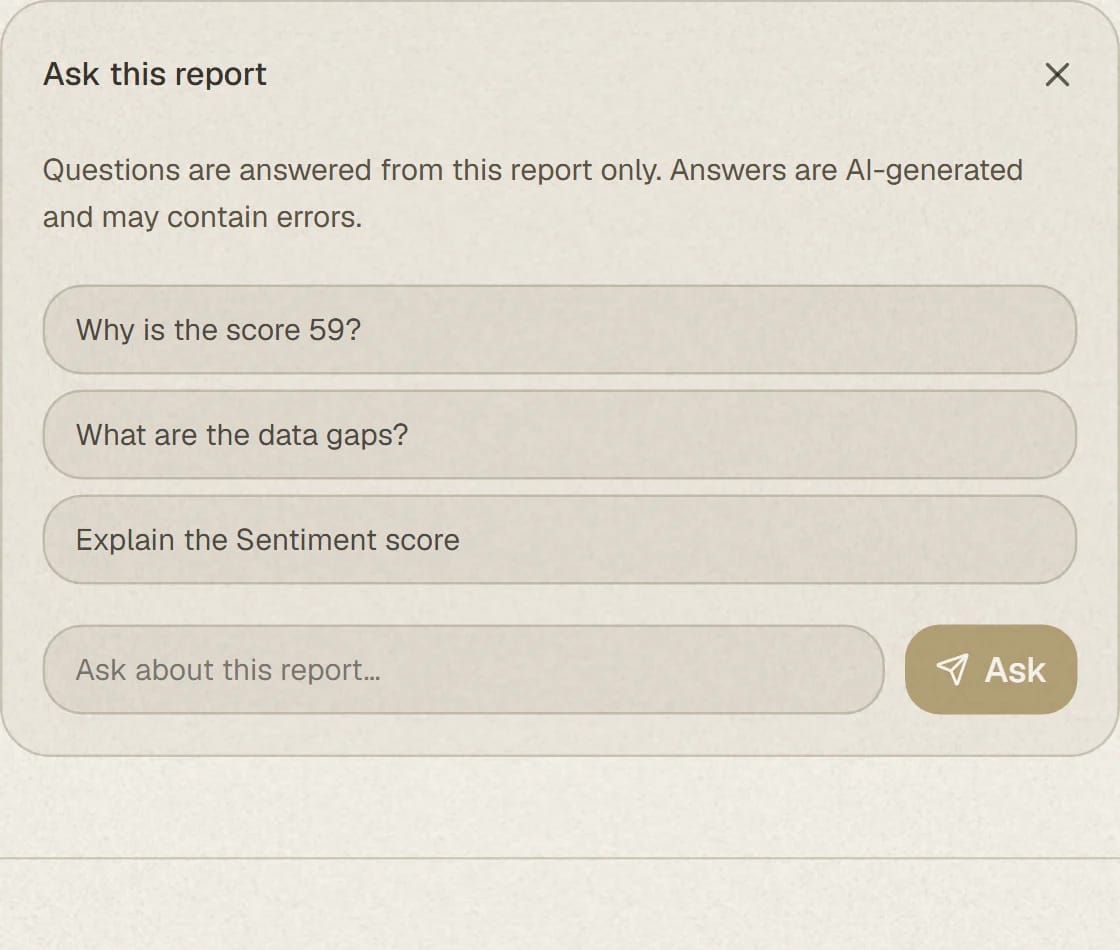
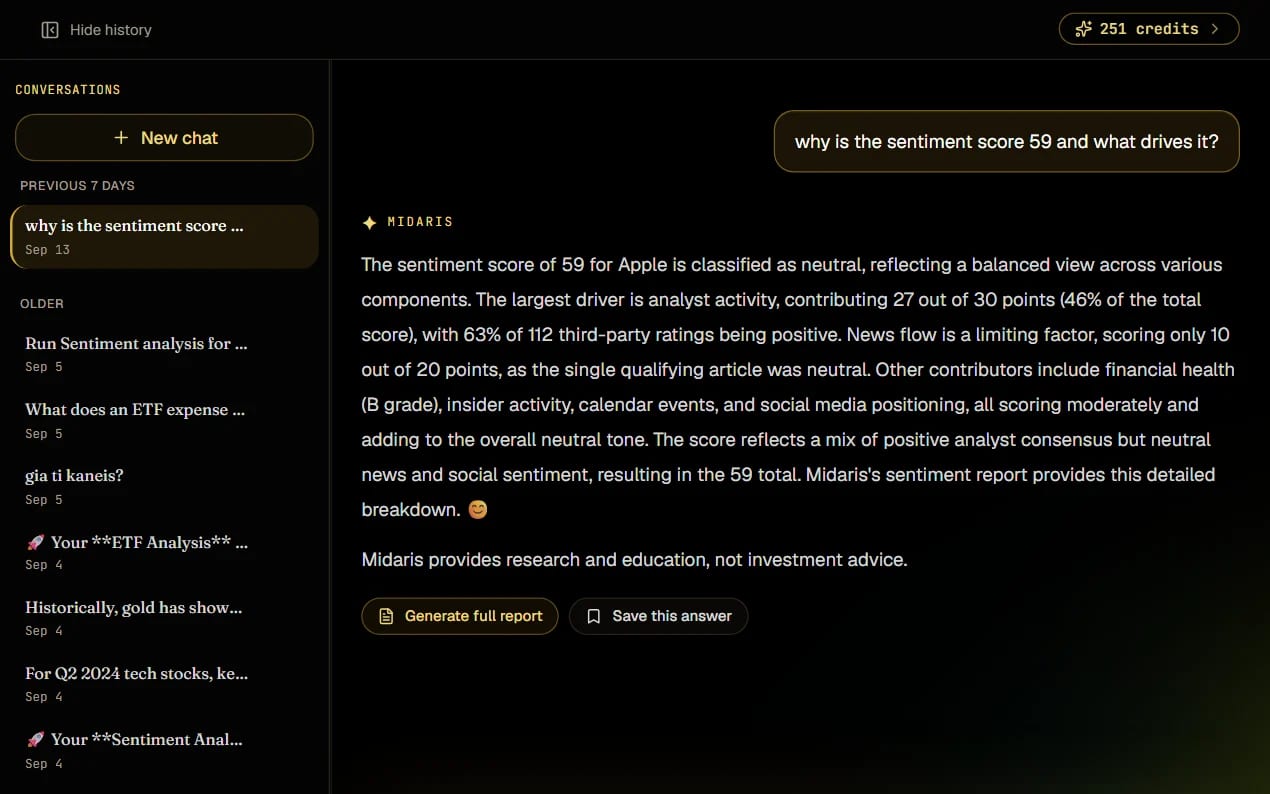
Research chat sits over the same modules as the reports. Ask about a ticker, a commodity or a macro theme in plain language; the answer is compiled from the same public data, and can be saved to your library.
Research report for informational purposes only — not investment advice.
MCP server
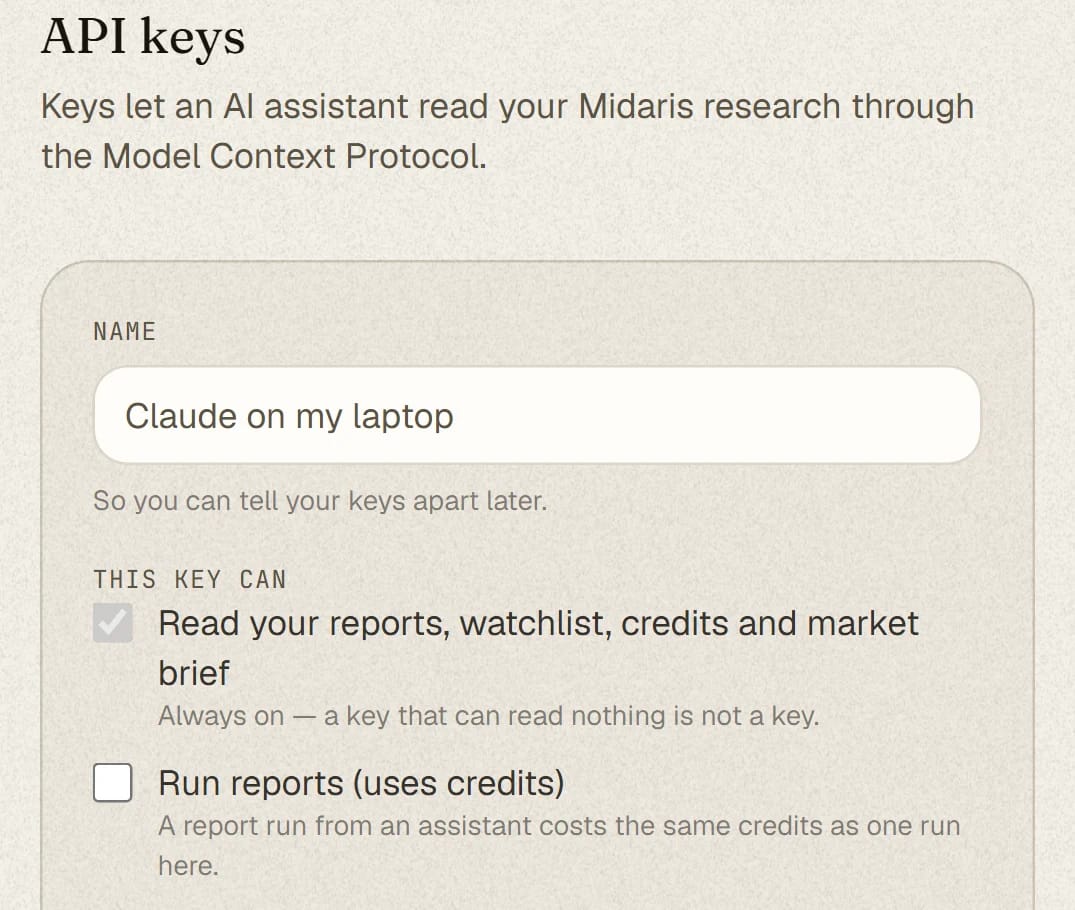
Connect your account with a key and Midaris becomes a set of tools inside Claude, ChatGPT, Cursor or any MCP-compatible assistant — in the same conversation you are already having. Same account, same credits, same sources, same standards.
The pre-market, pulse and closing market brief, on request, with its sources.
List and open any completed Midaris report, and ask questions about it where you are.
Start any report type your plan includes; it runs on Midaris and lands in your library.
Your watchlist and your credit balance, when you ask for them.
Research report for informational purposes only — not investment advice. Every answer carries its data notice.
Plans
Midaris is subscription-based. During early access, new accounts receive starter credits by invitation; paid plans open when billing goes live.
The six core report types with 100 monthly credits. A structured starting point for AI-assisted market research and education.
or $828 a year · save 30%
Double the credits at a lower cost per report, plus Peer Comparison, Catalysts & Earnings, Institutional Positioning and Portfolio Analysis, with priority processing.
or $1,668 a year · save 30%
Maximum credits at the lowest cost per report, every report type, Portfolio Analysis, the Midaris MCP server for Claude and ChatGPT, your own logo and firm details on reports and shared links, and dedicated support.
or $2,508 a year · save 30%
One report, one run. No subscription, no account to keep running — useful when there is one question and no reason to keep paying after it is answered.
One report, one run.
Choose Sentiment, ETF or Commodities. Your report stays available for 7 days.
One report, one run.
Choose Fundamentals, Technical or Global. Your report stays available for 7 days.
For firms
The same reports, shared across a desk instead of an account: seats for the people who run them and the people who only read them, and a layer that puts your disclaimer, your theme and your domain around every one that goes out.
Credits reset monthly. Every report type costs a set number of credits that depends on the plan — see the table below. Prices in USD; local currency and tax will be shown at checkout when billing opens. See the Refund Policy and Terms.
Subscriptions renew monthly or annually until cancelled; cancel any time, access continues to the end of the paid period.
Early access is by invitation. An invite gives a plan, a starter allowance of credits and a set period, shown in your account. No card is taken and nothing renews until billing opens.
Each report costs a fixed number of credits. The higher the plan, the fewer credits the same report takes — so the price per report falls as you move up.
| Report | Starter100 credits / mo | Professional200 credits / mo | Advisor300 credits / mo |
|---|---|---|---|
| Stock Fundamental | 14credits | 7credits | 4credits |
| Stock Technical | 15credits | 8credits | 5credits |
| ETF Analysis | 5credits | 3credits | 2credits |
| Sentiment | 3credits | 2credits | 1credit |
| Peer ComparisonProfessional and up | — | 6credits | 3credits |
| Catalysts & EarningsProfessional and up | — | 6credits | 3credits |
| Institutional PositioningProfessional and up | — | 12credits | 7credits |
| Global Analyst | 15credits | 8credits | 5credits |
| Commodity Research | 7credits | 4credits | 3credits |
| Portfolio AnalysisProfessional and up | — | 18credits | 9credits |
| Research chatper 10 messages | 1credit | 1credit | 1credit |
Credits are deducted when a report is run. A report that fails is not charged.
Prices in USD. Credits from a pack do not expire while the account is active.
Learn
A report is only worth what you can get out of it, so there is a guide to every one of them — ten in all: what that report measures, how to read the sections in the order they are laid out, and, at the end of each one, what it does not tell you.
Beside them are three worked routines — someone’s actual sequence for looking at a name they are considering, for the days around an earnings date, and for a monthly read of a portfolio. There is a glossary for every term the reports use. And there is a piece on how the scores are built, component by component. All of it is public, and none of it needs an account.
Questions
Reports, summaries and chat answers are generated by AI from public and licensed market data; they may contain errors and are research and education, not investment advice.
No. Midaris is software for financial research and education. It compiles and organises publicly available market data into structured reports for informational purposes. It does not provide investment, legal or tax advice, and it is not a registered investment adviser or broker-dealer.
Every report carries that notice, and nothing in the product asks about your circumstances or tells you what to do. Decisions are yours; consult an independent licensed professional about your own situation.
People who research markets and want a structured first pass they can check: self-directed investors, students and educators in finance, analysts and writers who need the public record on a company, fund, commodity or theme organised in one place.
From licensed and public market data: company fundamentals, prices and technical series, ETF holdings, news and analyst actions, futures positioning (CFTC Commitments of Traders), SEC insider and institutional filings, and macro series. Each report names the sources it drew on and lists any data gaps it found. Every provider, how fresh each kind of data is, and what is generated by AI are listed on the Data Sources page.
Each scored report composes a 0–100 figure from named components — for Sentiment, for instance, news, analyst actions, social, VIX, DXY, insider activity, calendar and COT — and shows every component next to the total. The score describes the data as compiled at that moment. It is not a prediction, and reports that lack a meaningful basis for one (Technical, Global Analyst) carry no score at all.
Yes. Midaris is built on AI and on third-party data, and both can be incomplete or mistaken. Reports state their confidence and their data gaps, and every figure should be checked against primary sources before it is relied on. Treat a report as one organised input into your own research, not as a conclusion.
Credits are the unit every plan is measured in. Each report type costs a fixed number of credits that depends on your plan — the table above shows all of them — and research chat costs 1 credit per 10 messages. Your allowance renews monthly. A report that fails to complete is not charged.
Not a trial in the classic sense. Until checkout opens, new accounts join early access by invitation and receive a small allowance of credits to run their first reports. Paid plans become available inside the app the day billing goes live.
You can read a real sample report of every type without an account.
A lens is a published, generic allocation model — the long-horizon growth literature, the Bengen and Trinity withdrawal studies, the classic institutional 60/40, the position-sizing and liquidity literature. Choosing one compares the portfolio you saved to that model. It records nothing about you: no goals, horizon, income or risk tolerance are asked for anywhere in the product.
Every report can be downloaded as a branded, paginated PDF with attribution and a QR code back to Midaris, and any report or chat answer can be bookmarked to your Saved library.
Yes, at any time; access continues to the end of the billing period. Refunds are governed by our Refund Policy, and payments are handled by our Merchant of Record.
Begin
Choose a plan, or open the sample report first and see exactly what a Midaris report contains.
Join the launch list — 30% off your first 3 months.